
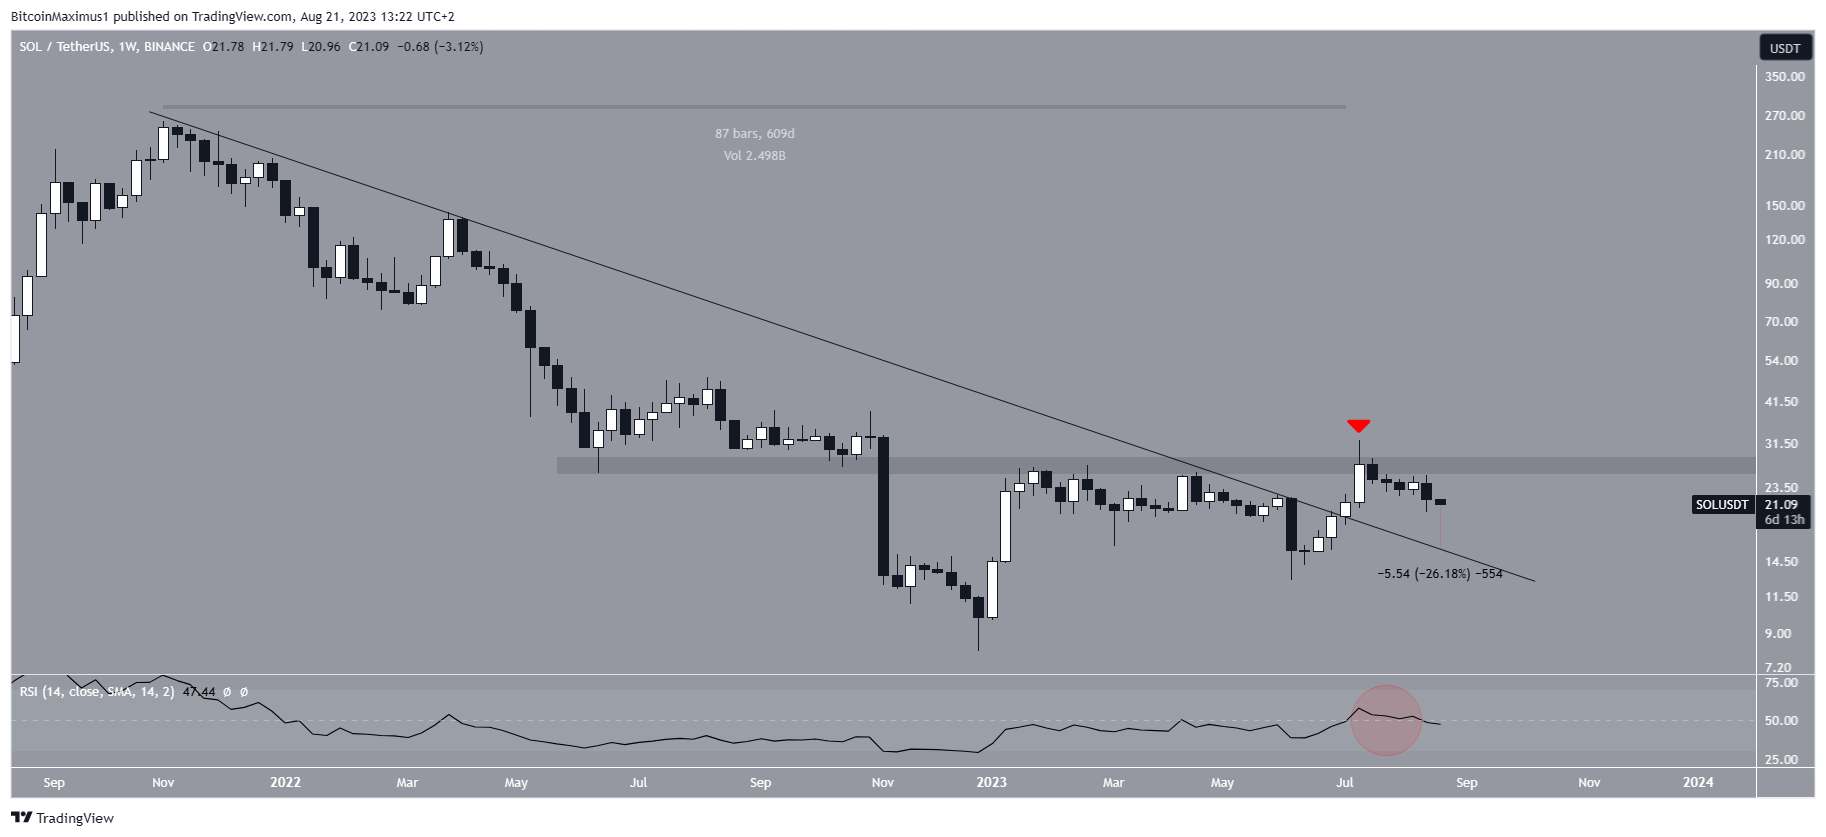
The Solana (SOL) price had fallen since the beginning of July when it deviated above the $27 horizontal resistance area.
While the weekly timeframe readings are not decisively bearish, those from the daily timeframe indicate that the downward movement is expected to continue in the near future.
Solana Price Suffers Rejection From Long-Term Resistance
The weekly time frame technical analysis for SOL shows that the price broke out from a long-term descending resistance line. The line had been in place since the all-time high, specifically for 609 days.
Breakouts from such long-term structures usually lead to significant upward movements. However, this was not the case for the SOL price. Solana was rejected by the $27 horizontal resistance area in July and created a long upper wick (red icon).
The wick is considered a sign of selling pressure, and it confirmed the $27 area as resistance. Therefore, the trend cannot be considered bullish despite the breakout. Rather, closing above the $27 area is required to confirm the trend as bullish.
Sponsored
Sponsored
The weekly Relative Strength Index (RSI) is leaning bearish. Traders commonly use the RSI as a momentum indicator to gauge whether a market is potentially overbought or oversold, aiding in decisions to accumulate or sell an asset.
An RSI reading above 50 and an upward trend signifies a favorable position for the bulls. Conversely, a reading below 50 implies the opposite.
Despite previously moving above 50 (red circle), the RSI is now at risk of falling below 50. This will mean that the breakout was invalid, and the trend is still bearish.
In that case, the SOL price could fall to the resistance line and validate it as support. The line is currently at $15.50, 26% below the current price.
Turning to new developments, Solana also launched a new application that rewards Artificial Intelligence (AI) data providers with crypto.
SOL Price Prediction: Here’s Why Decrease Will Continue
In contrast to the relatively neutral outlook from the weekly technical analysis, the daily trend displays a bearish sentiment. The primary cause for this lies in the deviation observed above the resistance area of $27, coupled with the formation of a very long upper wick (white circle) that was followed by a significant decline.
These wicks are considered signs of selling pressure and are especially important in cases when they cause deviations such as this one.
Moreover, SOL created a lower high (red icon) on August 15, which accelerated the rate of decrease and led to a low of $20 two days later. These occurrences, along with the failure of the price to reach the $27 mark, are indicative of indications of weakness.
Additionally, the daily Relative Strength Index (RSI) has slipped beneath the 50 mark and is on a descending trajectory (red circle). This confirms that the daily trend is tilting towards a bearish disposition. In that case, a 26% drop towards the ascending support line at $15.40 is expected.
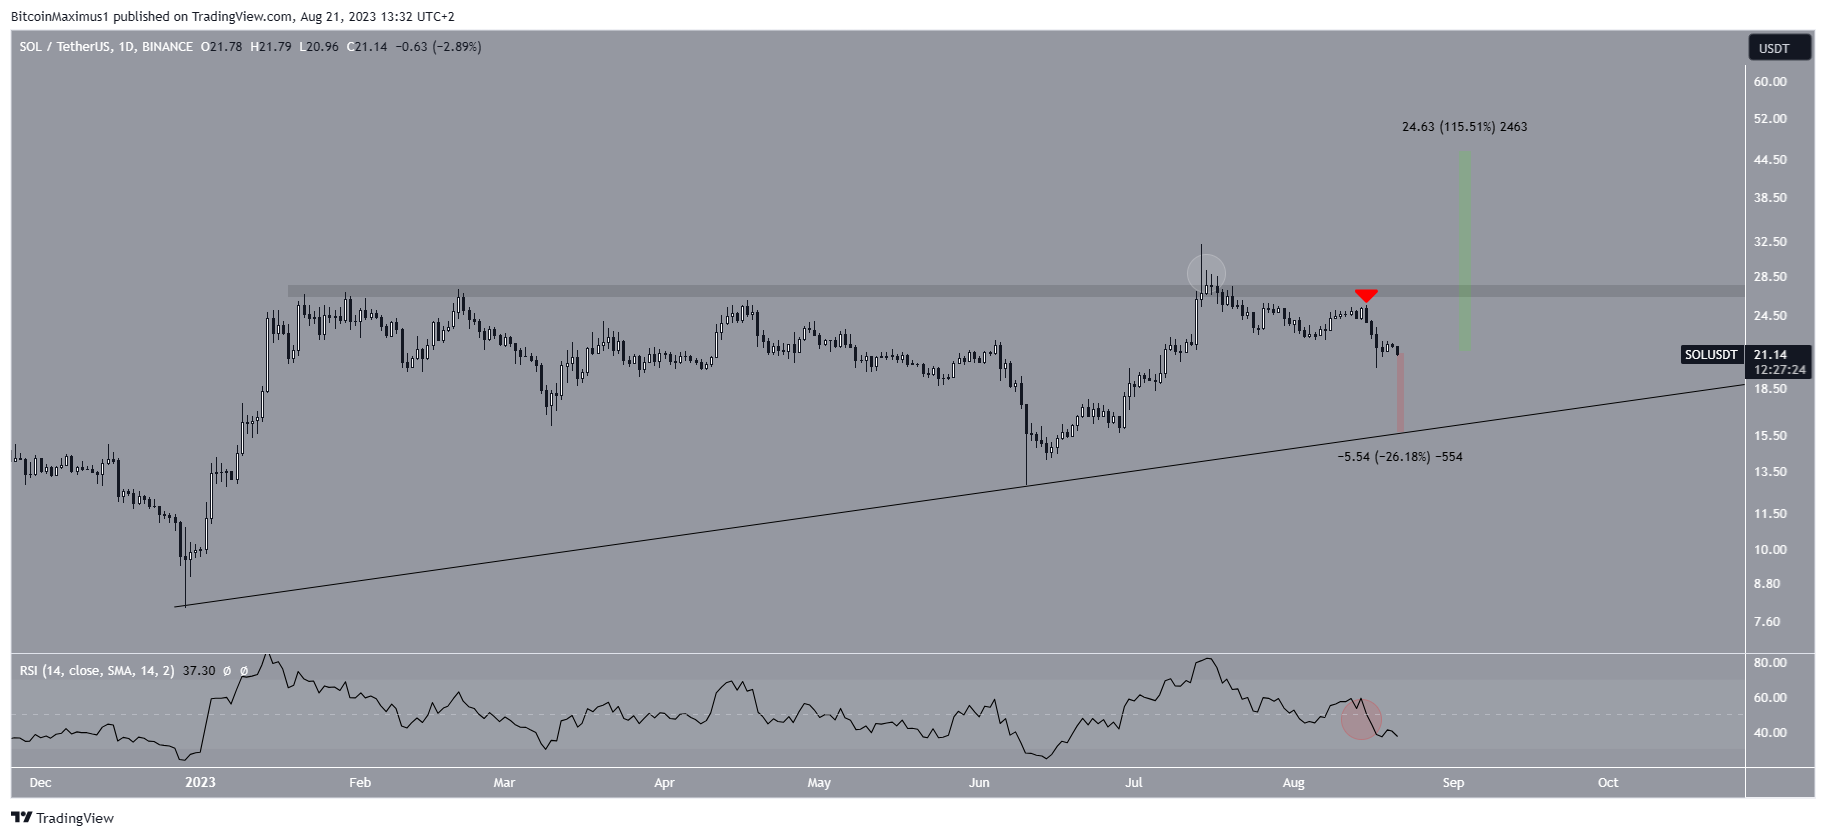
Despite the bearish price prediction for the SOL price, it’s worth noting that if the price manages to close above the $27 level, it will signify that the bullish trend remains intact.
In such a scenario, a conceivable future price scenario could involve a significant increase of about 115%, leading toward the subsequent resistance at $46.
For BeInCrypto’s latest crypto market analysis, click here
Disclaimer
In line with the Trust Project guidelines, this price analysis article is for informational purposes only and should not be considered financial or investment advice. BeInCrypto is committed to accurate, unbiased reporting, but market conditions are subject to change without notice. Always conduct your own research and consult with a professional before making any financial decisions.







