• Crypto
    • Bitcoin
    • Ethereum
    • Altcoins
    • Cardano
    • Solana
  • Web 3
    • Metaverse
    • NFT
  • Blockchain
  • Analysis
  • Learn
  • AI & VR
  • Gaming
  • Marketcap
  • Shop
What's Hot

Is Staking Crypto Safe? What You Should Know Before Staking

September 15, 2026

What Is the CLARITY Act and What Does It Mean for Crypto?

September 14, 2026

What Is Cross Margin in Crypto? How It Works, Risks, and Examples

September 14, 2026
Facebook Twitter Instagram
  • Contact
  • Disclosure
  • Privacy Policy
  • Terms & conditions
Facebook Twitter Instagram
VIP Crypto Signals
  • Crypto
    • Bitcoin
    • Ethereum
    • Altcoins
    • Cardano
    • Solana
  • Web 3
    • Metaverse
    • NFT
  • Blockchain
  • Analysis
  • Learn
  • AI & VR
  • Gaming
  • Marketcap
  • Shop
VIP Crypto Signals
Home » Blog » 44.2% Of Ethereum Holders Now In Loss, Is This The Bottom?
Altcoins

44.2% Of Ethereum Holders Now In Loss, Is This The Bottom?

September 5, 2023No Comments3 Mins Read
Share
Facebook Twitter LinkedIn Pinterest Email

On-chain data shows that 44.2% of all Ethereum investors are now carrying their coins at a loss, a sign that the bottom may be close for the asset.

Ethereum Percentage Of Holders In Loss Has Surged Recently

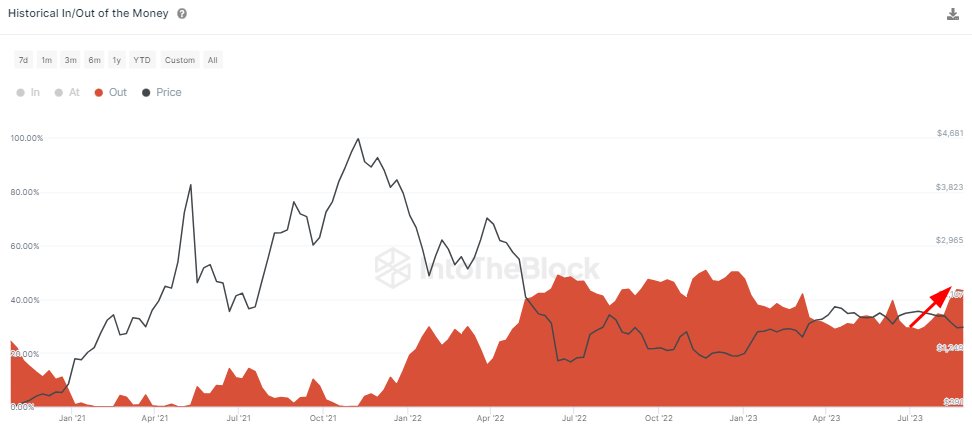
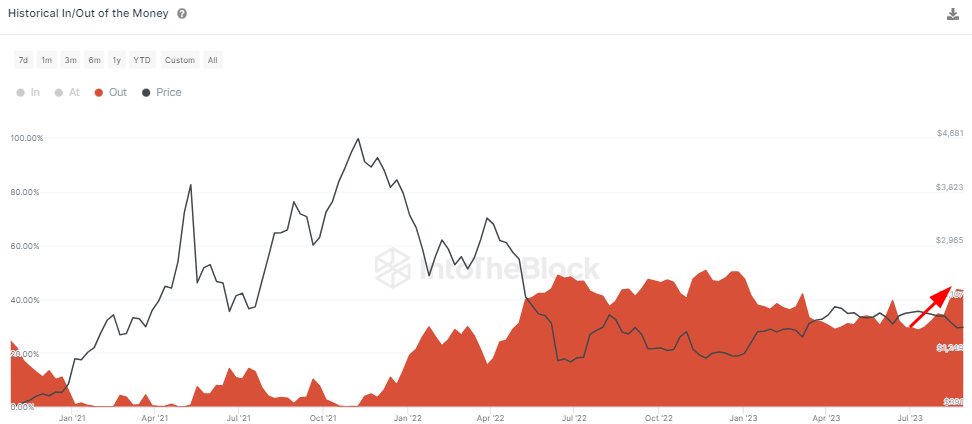
According to data from the market intelligence platform IntoTheBlock, the percentage of ETH investors in loss has grown sharply since early July. The relevant indicator here is the firm’s “Historical In/Out of the Money,” which tells us about the percentage of Ethereum investors in profits and losses and those that are just breaking even.

The metric determines whether an investor is in profit or loss by looking at their address history to check for the average price at which they acquired their coins. Naturally, if the asset’s current spot price is less than a holder’s cost basis, then that particular holder is carrying their coins at a net profit.

Similarly, the cost basis being equal to and less than the spot price would imply that the investor is breaking even on their investment and holding at a loss, respectively.

Now, here is a chart that shows the trend in the Historical In/Out of the Money indicator for Ethereum over the past few years:
Ethereum Loss

The value of the metric seems to have been going up in recent weeks | Source: IntoTheBlock on X

IntoTheBlock has only listed the data for the Ethereum investors in losses, as this is the number of interest in the current discussion. The combined percentage of the investors breaking even and carrying profits can also be deduced from this value, as the total percentage must add up to 100%.

See also  OP traders show bullish bias but will lack of spot demand cause trouble?

In early July, Ethereum holders underwater were at about 27%. It’s visible in the graph, however, that the indicator has observed a notable uplift since then, as the price of the cryptocurrency has registered a drawdown.

Today, the indicator’s value is at 44.2%, meaning that almost half of the Ethereum user base is holding their coins at losses. Generally, the more the investors get into profits, the more likely they become to sell to harvest those gains.

Due to this reason, corrections in the asset become more probable to form whenever an extreme majority of the market is enjoying profits. A large percentage of the holders being in losses instead, however, can have the opposite effect on the price since they can lead towards bottoms as profit sellers become exhausted.

Related Reading: This Could Be The Metric To Watch For A Bitcoin Bounce: Santiment

Since the start of the bear market last year, the highest the metric’s value has gone is 50%, implying that exactly half of the investors had been in losses back then. This value isn’t too far off from the current one, suggesting that Ethereum may be close to forming a bottom.

If a similar loss percentage is hit with the bottom this time, ETH would first suffer from some more downtrend so that enough investors drop underwater.

ETH Price

Ethereum has continued to move flat recently; as of this writing, it trades at about $1,600.

Ethereum Price Chart

Looks like ETH is still struggling to find any volatility | Source: ETHUSD on TradingView

Featured image from Kanchanara on Unsplash.com, charts from TradingView.com, IntoTheBlock.com

See also  All the reasons why Ethereum is struggling to catch up with Bitcoin


Source link

Bottom Ethereum Holders loss
Share. Facebook Twitter Pinterest LinkedIn Tumblr Email

Related Posts

What Is PnL in Crypto? Profit and Loss Meaning, Formula, and Examples

June 13, 2026

Top 10 Best Ethereum Wallets 2026

June 10, 2026

Double Bottom Pattern in Crypto: How to Spot and Use the W Formation

May 28, 2026

What Is Gwei in Crypto? A Guide to Ethereum Gas Fees

May 9, 2026
Add A Comment

Leave A Reply Cancel Reply

Top Posts

Is Staking Crypto Safe? What You Should Know Before Staking

September 15, 2026

What Is the CLARITY Act and What Does It Mean for Crypto?

September 14, 2026

What Is Cross Margin in Crypto? How It Works, Risks, and Examples

September 14, 2026

Subscribe to Updates

Get the latest news and Update from VIP Crypto Signals about Crypto, Web3, Metaverse, NFT and more.

Our mission is to develop a community of people who try to make financially sound decisions. The website strives to educate individuals in making wise choices about Cryptocurrencies, NFT, Metaverse and more.

We're social. Connect with us:

Facebook Twitter Instagram Pinterest YouTube
Top Insights

Is Staking Crypto Safe? What You Should Know Before Staking

September 15, 2026

What Is the CLARITY Act and What Does It Mean for Crypto?

September 14, 2026

What Is Cross Margin in Crypto? How It Works, Risks, and Examples

September 14, 2026
Get Informed

Subscribe to Updates

Get the latest news and Update from VIP Crypto Signals about Crypto, Web3, Metaverse, NFT and more.

Facebook Twitter Instagram Pinterest
  • Contact
  • Disclosure
  • Privacy Policy
  • Terms & conditions
© 2026 Vip Crypto Signals - All rights reserved.

Type above and press Enter to search. Press Esc to cancel.

  • FibSwap DEXFibSwap DEX(FIBO)$0.0084659.90%
  • bitcoinBitcoin(BTC)$70,953.006.13%
  • ethereumEthereum(ETH)$3,664.5818.50%
  • tetherTether(USDT)$1.00-0.01%
  • binancecoinBNB(BNB)$627.698.99%
  • solanaSolana(SOL)$181.131.69%
  • staked-etherLido Staked Ether(STETH)$3,662.5418.48%
  • usd-coinUSDC(USDC)$1.00-0.02%
  • rippleXRP(XRP)$0.545.05%
  • dogecoinDogecoin(DOGE)$0.1634778.14%

