• Crypto
    • Bitcoin
    • Ethereum
    • Altcoins
    • Cardano
    • Solana
  • Web 3
    • Metaverse
    • NFT
  • Blockchain
  • Analysis
  • Learn
  • AI & VR
  • Gaming
  • Marketcap
  • Shop
What's Hot

Is Staking Crypto Safe? What You Should Know Before Staking

September 15, 2026

What Is the CLARITY Act and What Does It Mean for Crypto?

September 14, 2026

What Is Cross Margin in Crypto? How It Works, Risks, and Examples

September 14, 2026
Facebook Twitter Instagram
  • Contact
  • Disclosure
  • Privacy Policy
  • Terms & conditions
Facebook Twitter Instagram
VIP Crypto Signals
  • Crypto
    • Bitcoin
    • Ethereum
    • Altcoins
    • Cardano
    • Solana
  • Web 3
    • Metaverse
    • NFT
  • Blockchain
  • Analysis
  • Learn
  • AI & VR
  • Gaming
  • Marketcap
  • Shop
VIP Crypto Signals
Home » Blog » This Pattern Points To $10,000+ Ethereum Price, But When?
Altcoins

This Pattern Points To $10,000+ Ethereum Price, But When?

October 24, 2023No Comments3 Mins Read
Share
Facebook Twitter LinkedIn Pinterest Email

This week, Bitcoin and other altcoins livened up the crypto market, potentially lifting up Ethereum price and saving it from further collapse.

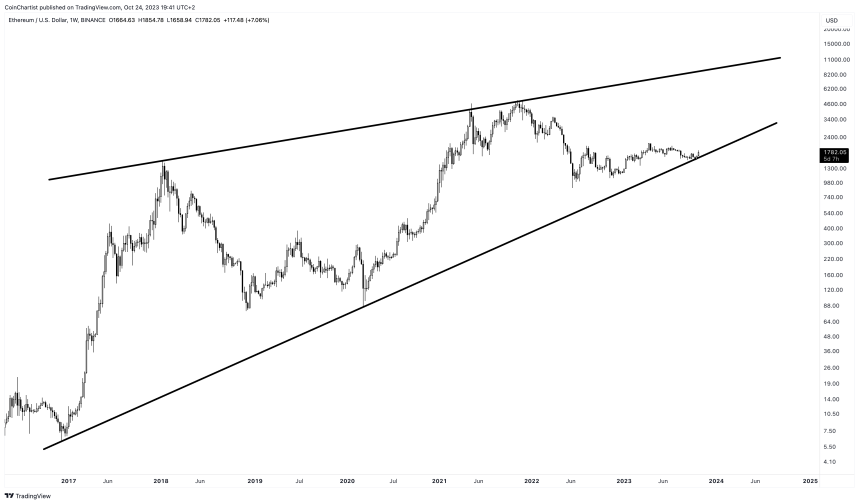
With ETH now moving away from the bottom trend line of a massive long-term price pattern, the next possible target is the upper trend line of the same pattern. That target points to $10,000 per Ether, but how long might it take to reach the lofty price objective?

Ethereum Rising Wedge Targets $10,000 Or More

For almost its entire history of price action, ETHUSD has been filling out what appears to be a massive rising wedge pattern. Such patterns are predominantly bearish, breaking down roughly 60% of the time.

That leaves 40% of the time that these patterns break upward. Descriptions of the pattern reveal that wedges are notoriously prone to false breakouts and/or false breakdowns, where price violates one trend line, only to reverse and target the other.

In the latest case, however, Ethereum is holding the bottom line. This makes the next logical target the upper trend line, with at least some probability that it can break upward still. The trend line, happens to be located at around $10,000 per ETH currently and rises with each passing day.

When ETHUSD touches the upper trend line is still up for question, but considering the length of past rallies lasting anywhere between six months to a year, it may be less of a wait than many expect.
ETHUSD_2023-10-24_13-42-16

Is $10,000 per ETH next? | ETHUSD on TradingView.com

Is This The Beginning Or End of ETH?

Ever wonder why a rising wedge pattern can break upward if it is a bearish pattern? In Elliott Wave Principle, wedges fall into the diagonal family of patterns. Diagonals can be leading or ending, expanding on contracting.

See also  Ethereum struggles amid ETH ETF outflows and rising supply - What now?

A leading diagonal kicks off a sustained move. It’s wedge-like appearance is deceiving as traders expect the pattern to break down, yet instead it breaks upward. In contrast, an ending diagonal finishes off a sustained move. In this case, the bearish breakdown that should be expected in a rising wedge plays out.

Ethereum is potentially in a massive diagonal pattern, not the rising wedge that it appears. What we also don’t know is if this is the beginning of a larger sustained move and a leading diagonal, or the end of the largest altcoin’s dominance capped off by an ending diagonal.

Both patterns form in a five-wave pattern. Unlike standard Elliott Wave patterns, diagonals have unique rules. For example, wave 1 must be the longest, wave 4 must enter wave 1 territory, and wave 5 is the shortest of the waves. Since this is the last wave and potentially the shortest of them all, the touch of the upper trend line could be on the way soon.

Source link

Ethereum Pattern points Price
Share. Facebook Twitter Pinterest LinkedIn Tumblr Email

Related Posts

What Is Bitcoin Halving & How Does It Affect BTC Price?

September 1, 2026

What Is the Evening Star Candlestick Pattern in Crypto?

June 29, 2026

What Is a Bull Flag Pattern in Crypto and How to Use It

June 20, 2026

Triple Top Chart Pattern in Crypto: How to Spot and Confirm It

June 12, 2026
Add A Comment

Leave A Reply Cancel Reply

Top Posts

Is Staking Crypto Safe? What You Should Know Before Staking

September 15, 2026

What Is the CLARITY Act and What Does It Mean for Crypto?

September 14, 2026

What Is Cross Margin in Crypto? How It Works, Risks, and Examples

September 14, 2026

Subscribe to Updates

Get the latest news and Update from VIP Crypto Signals about Crypto, Web3, Metaverse, NFT and more.

Our mission is to develop a community of people who try to make financially sound decisions. The website strives to educate individuals in making wise choices about Cryptocurrencies, NFT, Metaverse and more.

We're social. Connect with us:

Facebook Twitter Instagram Pinterest YouTube
Top Insights

Is Staking Crypto Safe? What You Should Know Before Staking

September 15, 2026

What Is the CLARITY Act and What Does It Mean for Crypto?

September 14, 2026

What Is Cross Margin in Crypto? How It Works, Risks, and Examples

September 14, 2026
Get Informed

Subscribe to Updates

Get the latest news and Update from VIP Crypto Signals about Crypto, Web3, Metaverse, NFT and more.

Facebook Twitter Instagram Pinterest
  • Contact
  • Disclosure
  • Privacy Policy
  • Terms & conditions
© 2026 Vip Crypto Signals - All rights reserved.

Type above and press Enter to search. Press Esc to cancel.

  • FibSwap DEXFibSwap DEX(FIBO)$0.0084659.90%
  • bitcoinBitcoin(BTC)$70,953.006.13%
  • ethereumEthereum(ETH)$3,664.5818.50%
  • tetherTether(USDT)$1.00-0.01%
  • binancecoinBNB(BNB)$627.698.99%
  • solanaSolana(SOL)$181.131.69%
  • staked-etherLido Staked Ether(STETH)$3,662.5418.48%
  • usd-coinUSDC(USDC)$1.00-0.02%
  • rippleXRP(XRP)$0.545.05%
  • dogecoinDogecoin(DOGE)$0.1634778.14%

