
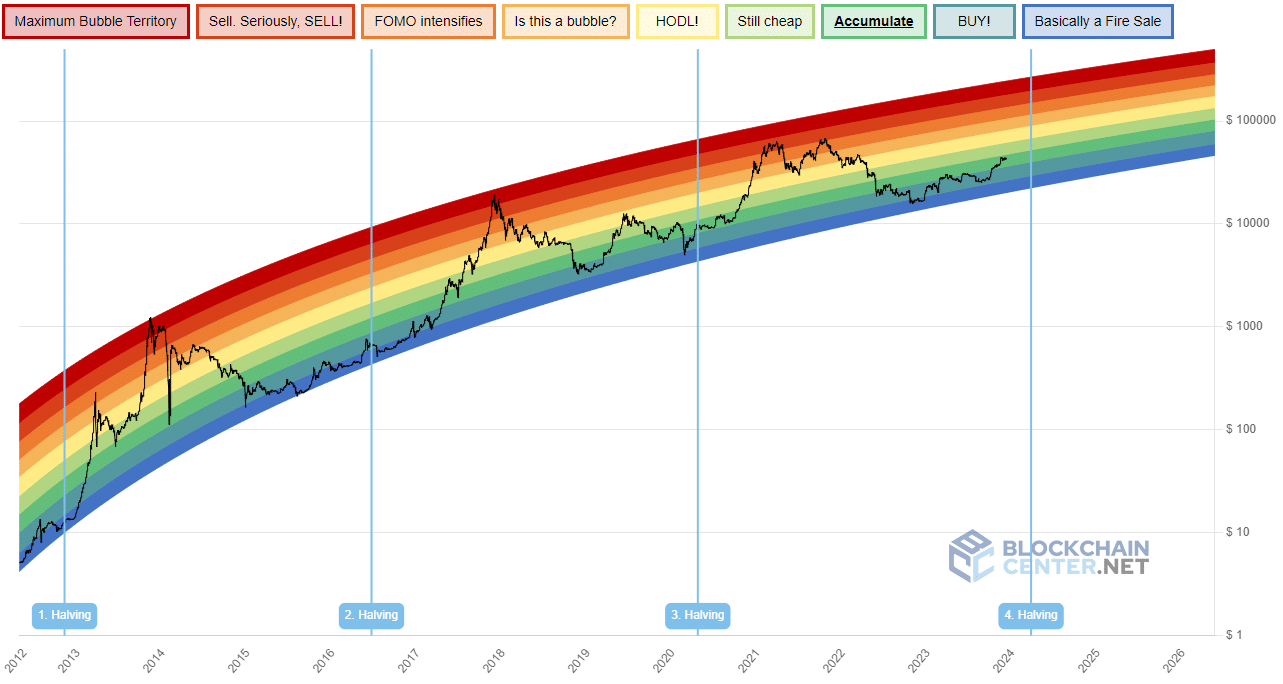
- Bitcoin’s rainbow chart was combined with a technical analysis of the weekly BTC price chart.
- The first half of 2025 could see Bitcoin establish the cycle’s high-water mark.
Bitcoin [BTC] prices have climbed higher since the 12th of September. The uptrend had many pullbacks and halts, but the trend was clear on the higher timeframe price charts.
Despite the many rumblings and failures inside the crypto industry in 2022, the king stood strong.
The end of 2023 is near, and the next Bitcoin halving is estimated to occur in April 2024. Looking into the future is impossible, but that doesn’t mean we can’t plan for it. So what will 2024 and 2025 yield in the BTC markets?
What new highs could we see? One strong contender for the crystal ball status is the Bitcoin rainbow chart.
It’s a good time to buy BTC, according to the rainbow chart

Source: BlockchainCenter.net
The Bitcoin rainbow chart is a fun-looking, colorful chart that outlines where BTC is at. Each color band has a meaning, a message for investors, although it’s not financial advice of course. At press time, BTC is trading within the “Accumulate” zone.
The halving events are marked as well, and the interpretation is pretty straightforward. Buy Bitcoin when it is below yellow and sell when it reaches the orange or red zones.
This is especially useful for long-term investors who don’t have the time or inclination to track BTC prices daily or to monitor multiple on-chain metrics.
In the past, the bull run has come around a year or later after the halving. Assuming the same for the next halving, we are likely to reach the top of this cycle in 2025. But when, and what would those prices be?
Technical analysis could help answer the question of “where”
The Fibonacci retracement and extension levels are a well-known and widely used technical analysis tool.
They perform remarkably well across different timeframes but depend on the judgment of the user in deciding the beginning and ending points.
In our case, we will be using a rally’s top and bottom, so that subjectivity can be ruled out. There was a strong rally from $3135 to $13.8k a year before Bitcoin’s 2020 halving. This move was used to plot the Fibonacci extension levels (white).

Source: BTC/USD on TradingView
The rally reached the 500% extension level 868 days after the initial move, or roughly 2.5 years later. This is information that can be valuable for another assessment.
Just like the previous time, BTC has rallied strongly in the year preceding its halving event.
We are still not yet at the local top. Bitcoin has a strong bullish trend and the market structure on the one-day chart continued to favor the buyers.
Yet, we can similarly plot the Fibonacci extension levels to find out where the 500% extension level would be.

Source: BTC/USD on TradingView
Assuming the $45k mark that the price reached on the 5th of December is this run’s top, the 500% extension level comes out to $192.7k.
Given the current bullish outlook for BTC on the one-day chart, $45k might not be the local top.
Going back to the rainbow chart, we see that the previous cycle saw BTC reach the lower red band in the bubble zone. Hence, we can assume that $192k would be roughly in the same band in 2025.
This is projected to be February 2025 on the rainbow chart.
So there you have it, a neat Bitcoin price prediction for the next cycle. For readers who want to assess some on-chain metrics, the NUPL chart could be interesting.
Additional on-chain metrics to keep an eye on
The Bitcoin Net Unrealized Profit/Loss metric measures the overall profit or loss of BTC investors. Values over ‘0’ indicate holders are in profit, and the rising trend of the past few months highlighted that more and more investors are in profit.

Source: CryptoQuant
The previous cycle saw this metric touch 0.748 on 21 February. Interestingly, the 2019 rally to $13.8k saw the NUPL reach 0.61.
Read Bitcoin’s [BTC] Price Prediction 2023-24
The metric was at 0.49 on the 27th of December, but a reading of 0.5 or above would mean the current move is likely nearing its end.
Once again, these inferences are made assuming that history would repeat itself. Sometimes, instead of repeating, it merely rhymes. Therefore, investors and traders must be vigilant and ready to incorporate new information into their plans.







