
An analyst has explained that PEPE could be breaking out of a descending channel pattern currently and may be heading towards these targets.
PEPE Has Been Breaking Out Of A Descending Parallel Channel Recently
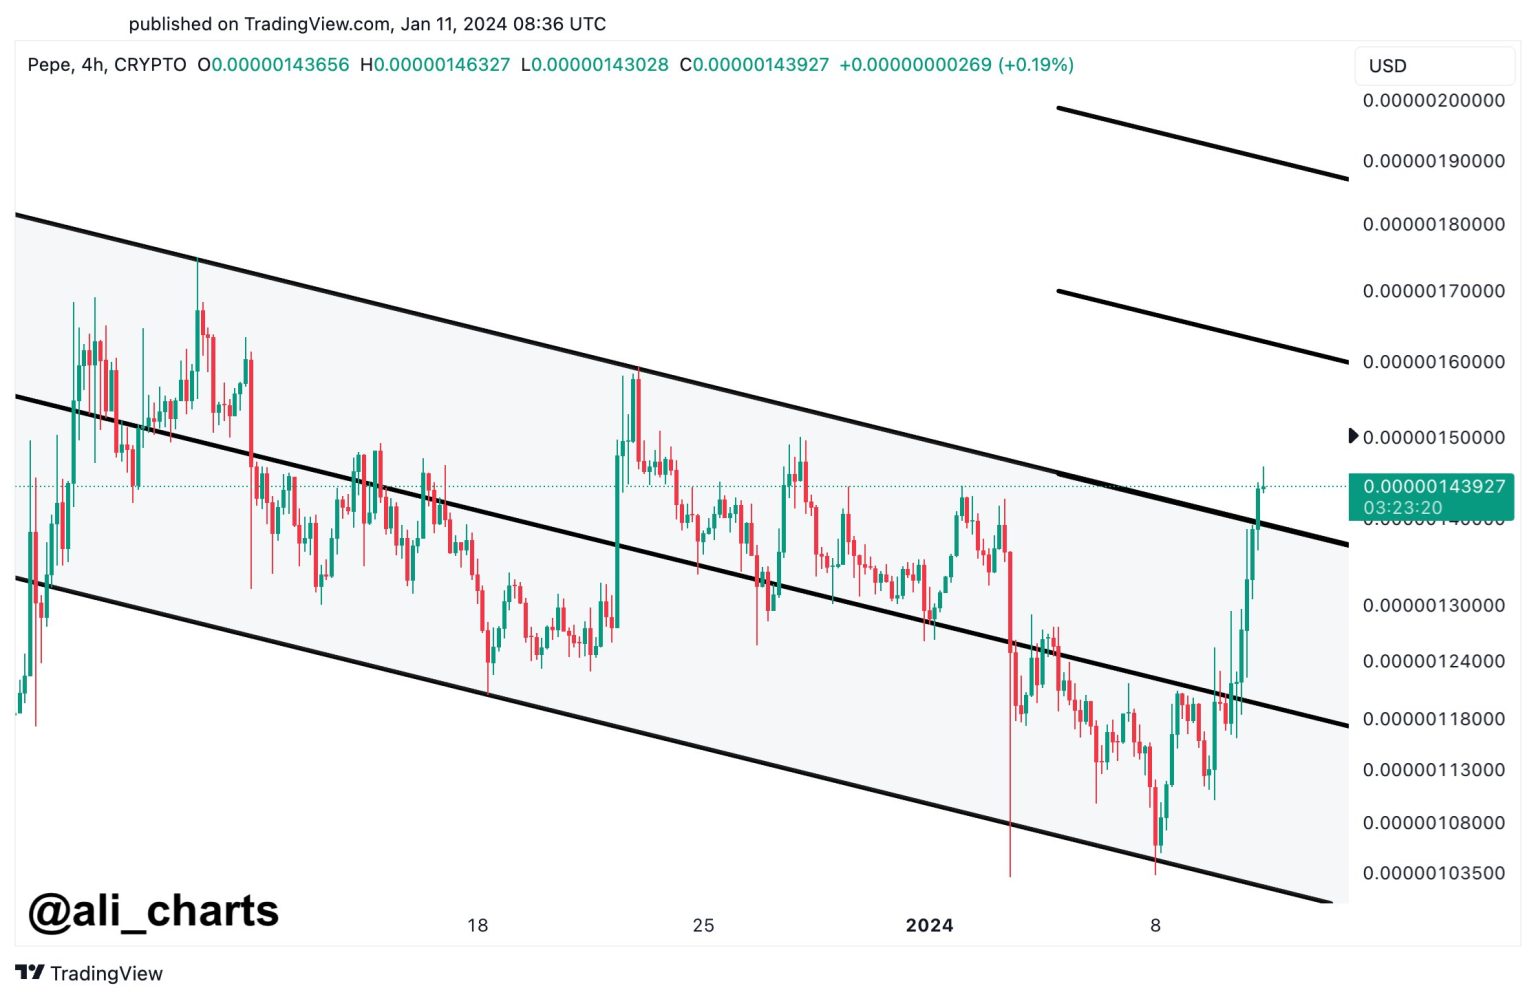
In a new post on X, analyst Ali pointed out how the 4-hour PEPE price is breaking out of a descending parallel channel currently. In technical analysis, a “parallel channel” refers to the area enclosed by two parallel trendlines where the price of the given asset has been traveling inside recently.
Generally, the price is likely to encounter resistance at the upper line of the channel, while the lower level could act as a source of support. Because of this reason, tops and bottoms are naturally probable to occur at the respective trendlines.
In the context of the current discussion, a parallel channel called a descending channel is of interest. As its name suggests, this channel represents a downtrend in the asset.
The upper line of the descending parallel channel is drawn by connecting together lower highs in the commodity’s price. Similarly, the bottom level joins together with lower lows.
Usually, breaks out of the channel can be significant as they may imply a continuation of the trend. This means that if the break is out of the upper line, it can be a bullish signal, while a drop under the lower level could be a sign that the bearish trend is strengthening.
Now, here is the chart shared by the analyst that highlights a descending parallel channel pattern that has been forming in the 4-hour price of PEPE recently:

Looks like PEPE has been showing a break above this pattern recently | Source: @ali_charts on X
As displayed in the above graph, PEPE had been trending inside this descending parallel channel pattern until the last 24 hours, when the meme coin enjoyed a sharp 16% jump and broke out of the upper level of the channel.
This quick rise in the cryptocurrency’s price has come as the Bitcoin spot ETFs have gained approval from the US SEC. While BTC itself has only seen a 4% from this bullish news, altcoins around the sector have gone ahead and started showing sizeable surges.
As PEPE now appears to be breaking out of the descending parallel channel, the meme coin could be set to continue its bullish momentum, as it has often happened historically with such breakouts.
That would only be, of course, if the breakout truly gets confirmed, as the coin has only just begun to rise above it. In the chart, Ali has marked the levels that PEPE could end up reaching if this bullish pattern comes to fruition.
$0.0000016 and $0.0000019 are the two price levels that the analyst has highlighted for the asset, as they are at distances equal to half-length and full-length of the channel, respectively.
Should the coin touch the former of these, it would have rallied almost 11% from the current price level, while a rise to the latter one would suggest an increase of over 31%.
PEPE Price
Following the sharp surge from the past day, the asset’s price is now trading around the $0.000001446 mark.
The price of the asset seems to have shot up over the past day | Source: PEPEUSD on TradingView
Featured image from Shutterstock.com, charts from TradingView.com
Disclaimer: The article is provided for educational purposes only. It does not represent the opinions of NewsBTC on whether to buy, sell or hold any investments and naturally investing carries risks. You are advised to conduct your own research before making any investment decisions. Use information provided on this website entirely at your own risk.







