
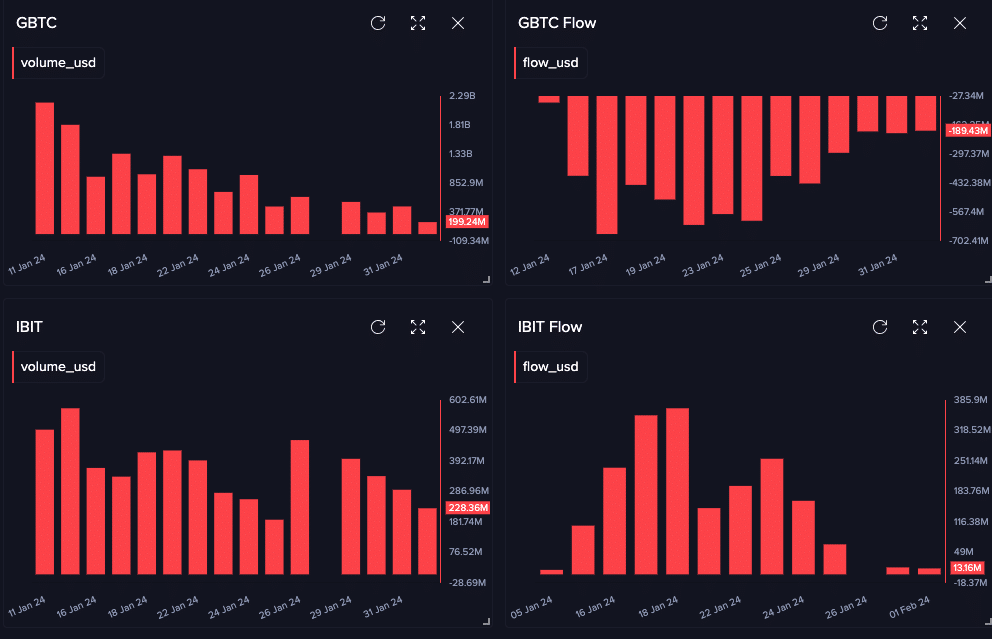
- The Netflow of most ETFs was more than Grayscale’s BTC outflow.
- Technical indicators and on-chain metrics suggest a Bitcoin rally in a few months.
For the first time since the Bitcoin [BTC] ETFs went live, the net balance of BlackRock (IBIT), Fidelity (FBTC), Bitwise (BITB) and Franklin Templeton (EZBC) was more than Grayscale’s cashout. AMBCrypto gathered the data after examining the inflows and outflows of the ETFs.
For most of the time, the Grayscale Bitcoin Trust ETF (GBTC) has dominated volumes. But not all of these volumes were inflows.
In the past weeks, Grayscale had been offloading GBTC in large numbers. These sell-offs were at the expense of Bitcoin’s price which once plummeted to $39,000 around the said period.
IBIT, FBTC are now in charge
But now that the dump has slowed down, other ETFs are gaining their ground. According to AMBCrypto’s query on Santiment, GBTC’s flow was -$189.43 million at press time. This was the lowest the flow has been since the 12th of January.
In terms of the volume, Grayscale could only boast of $199.24 million. This means that BlackRock’s IBIT had much more in Bitcoin trading.

Source: Santiment
We also evaluated the volume of FBTC and BITB. At press time, on-chain data showed that Fidelity’s FBTC has more Bitcoin trading volume than Grayscale with $893.16 million. However, Bitwise’s BITB was lower with $64.59 million.
Furthermore, the recent decline in GBTC could mark a turnaround for Bitcoin. If the firm continues to slow down its outflows, we could see an uptick in BTC’s price. A few weeks ago, BTC jumped to $49,000 as a result of the SEC ETF approval.
But the event later turned out to be disastrous for the coin price as it slid. But the last 24 hours have brought some sort of respite for Bitcoin.
At the time of writing, the price of BTC was $43.073, representing a 2.08%. As such, there is a chance that the price could head higher than what it was.
Is the change for Bitcoin’s gain?
Should Grayscale finally halt selling, Bitcoin might head back to $49,000. But this prediction would take more than a decreasing outflow and more ETF buy orders. Another possible catalyst that might push Bitcoin’s price could be the competition between these companies.
Typically, it is expected that each of these firms would want to have a higher volume than the others.
Therefore, demand for Bitcoin might increase as the fight for market share heats up. But at the same time, it is also important to check BTC’s potential from a technical point of view.
At press time, Bitcoin had not become extremely volatile, as shown by the Bollinger Bands (BB). This implies that the coin might continue trading within a small margin. In a highly bearish scenario, BTC might drop to $41,726. But if the momentum is bullish, the coin might hit $44,000.
The Aroon indicator also showed that sellers’ (Aroon Down-blue) dominance was waning while buyers (Aroon Up-orange) were slowly retaining control. Should this remain the case, then BTC’s uptrend might continue in the long run.

Source: Santiment
But in the short term, the potential rise to $49,000 might not be immediate. This was because of the indication the Chaikin Money Flow (CMF) showed. At press time, the CMF was -0.02.
The negative reading of the CMF signals a higher distribution than accumulation. If the CMF eventually turns positive, then Bitcoin might produce a significant upward run.
Large players have been buying the “blood”
One other metric AMBCrypto checked in assessing Bitcoin’s price potential was the Accumulation Trend Score. The Accumulation Trend Score reflects the relative size of entities that are actively accumulating coins on-chain in terms of their BTC holdings.
When the Accumulation Trend Score is closer to 1, it indicates that on aggregate, larger entities are accumulating. However, an Accumulation Trend Score closer to zero indicates that entities are distributing.

Source: Glassnode
How much are 1,10,100 BTCs worth today?
As of this writing, Glassnode’s data showed that the Accumulation Trend Score was exactly 1. This value means that a lot of large entities were aggressively buying the Bitcoin dip.
If accumulation continues to increase, BTC’s price can significantly appreciate in a few months from now.







