- BTC was up by more than 10% in the last seven days.
- Metrics suggested selling pressure was low, and a few indicators looked bullish.
Bitcoin [BTC] showcased a bullish performance in the last week, as its value surged by more than 10%. In the last 24 hours alone, the king coin’s price went up by over 2%.
At the time of writing, BTC was trading at $57,141.35 with a market capitalization of over $1.12 trillion. As per a recent tweet from IntoTheBlock, BTC’s recent uptrend made 95% of its investors profitable.
This raised the chances of holdings getting liquidated. To check whether the assumption could come true, AMBCrypto took a look at BTC’s metrics.
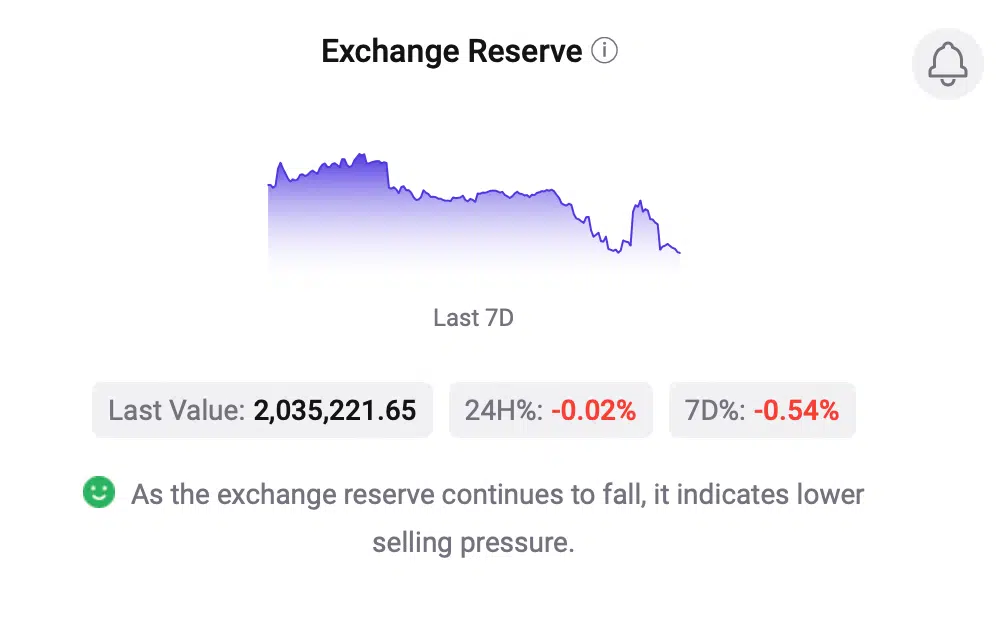
Our analysis of CryptoQuant’s data revealed that Bitcoin’s exchange reserve was dropping at press time. This meant that selling pressure was not high.
Its Coinbase premium was also in the green, meaning that buying sentiment was dominant among US investors at the time of the report.
Things look bullish for Bitcoin
The chances of Bitcoin’s downtrend because of high sell pressure looked unlikely, recent data showed. Thus, there were increased chances of BTC continuing its bull rally.
Notably, the coin’s MVRV Z score scored +2 for the first time this bull cycle, which has historically risen during bull rallies.
However, Philip Swift, the founder of LookintoBitcoin, tweeted that there was still a long way to go before this cycle became overheated.
Next, to better understand the possibility of a continued northward price movement, AMBCrypto checked Bitcoin’s daily chart. Our analysis pointed out that BTC’s MACD displayed a bullish crossover at press time.
This suggested that the bull rally might last longer.
Read Bitcoin’s [BTC] Price Prediction 2024-25
On the flip side, though, BTC’s Relative Strength Index (RSI) was in the overbought zone.
Its Chaikin Money Flow (CMF) also registered a slight downtick, which indicated that the possibility of a price correction in the short term can’t be ruled out.


