- Bitcoin holders have begun to sell at a loss after an extended period of making a profit.
- Key technical indicators showed that the bears are in control of the market.
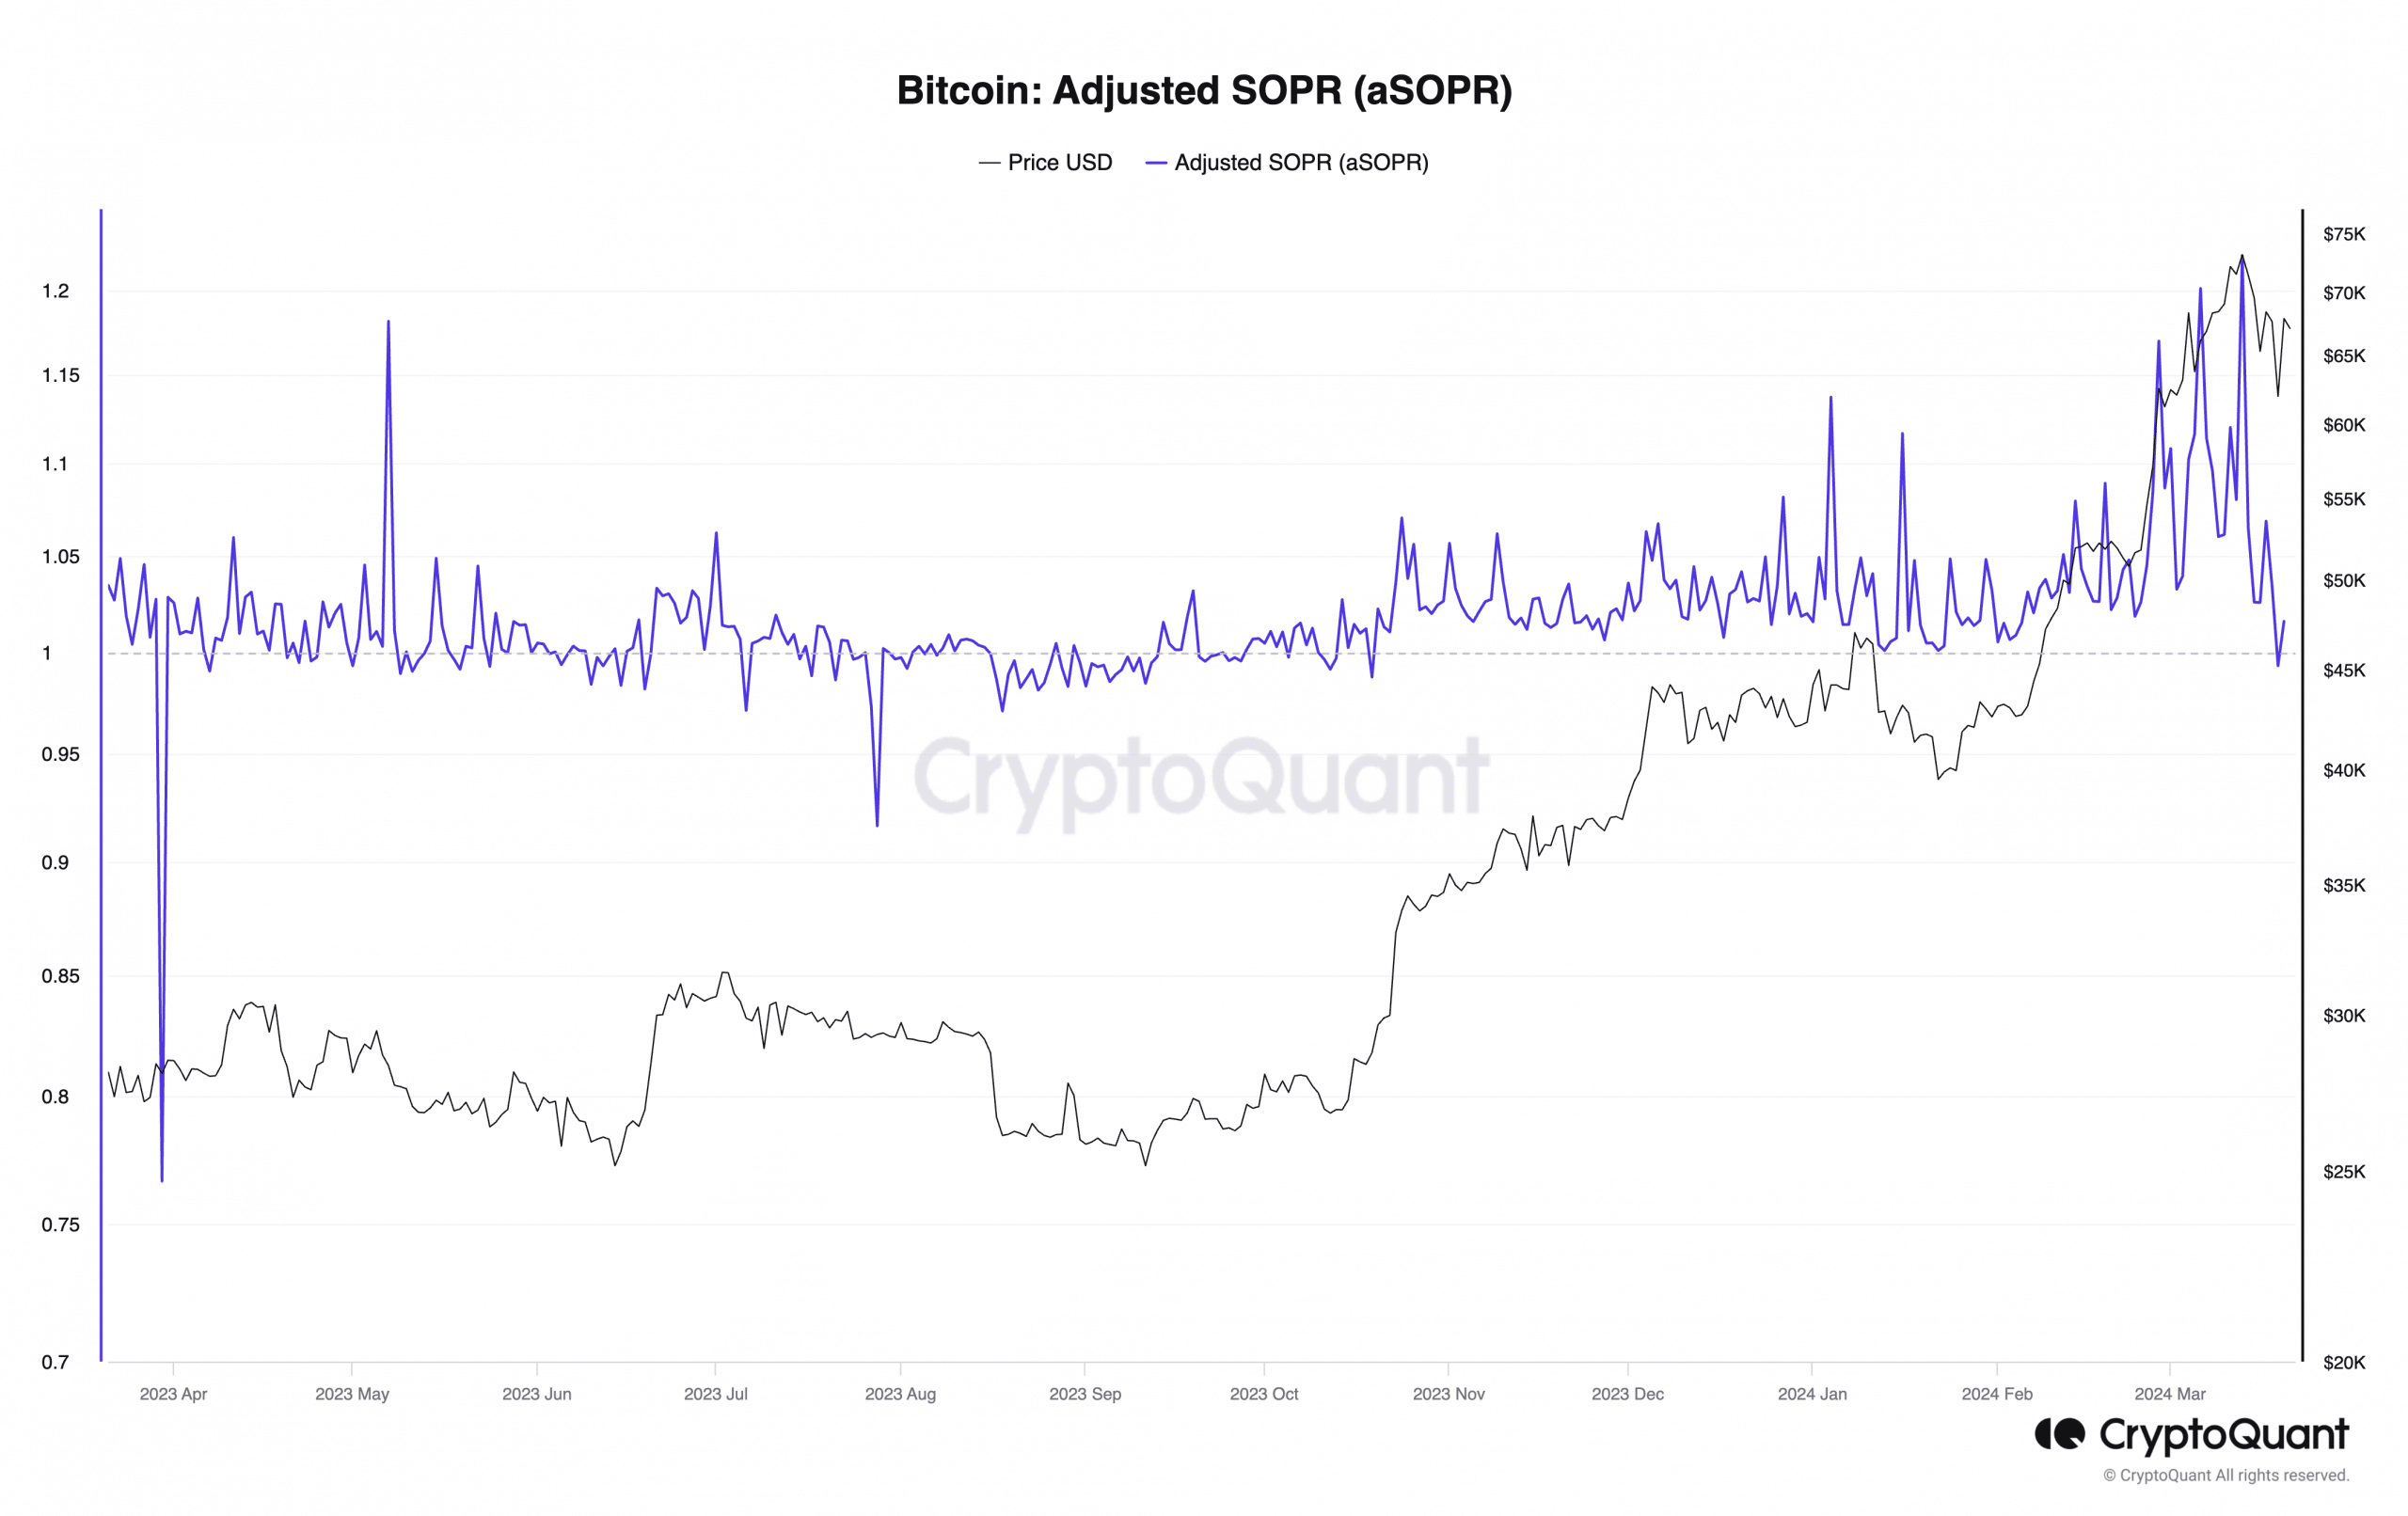
Bitcoin’s [BTC] Adjusted Spent Output Profit Ratio (aSOPR) has fallen below 1 for the first time since October 2023, according to CryptoQuant data. This indicates that, on average, investors are now selling their holdings at a loss.

Source: CryptoQuant
BTC’s aSOPR measures the profit or loss realized when the coin is spent by its holders. An aSOPR value above 1 signifies that coins are being sold at a profit overall. Conversely, a value below 1 suggests that investors are selling at a loss.
Recent surge in profit-taking activity
BTC’s recent price slip under $61,500 has led to a significant surge in sell-offs amongst its holders. According to CryptoQuant’s data, the market has seen a rise in BTC’s supply on exchanges. Its exchange reserve has spiked by 1% in the past seven days.
As of this writing, 2.006 million BTC were held across cryptocurrency exchanges. When an asset’s reserve climbs this way, it suggests a rally in selling pressure.
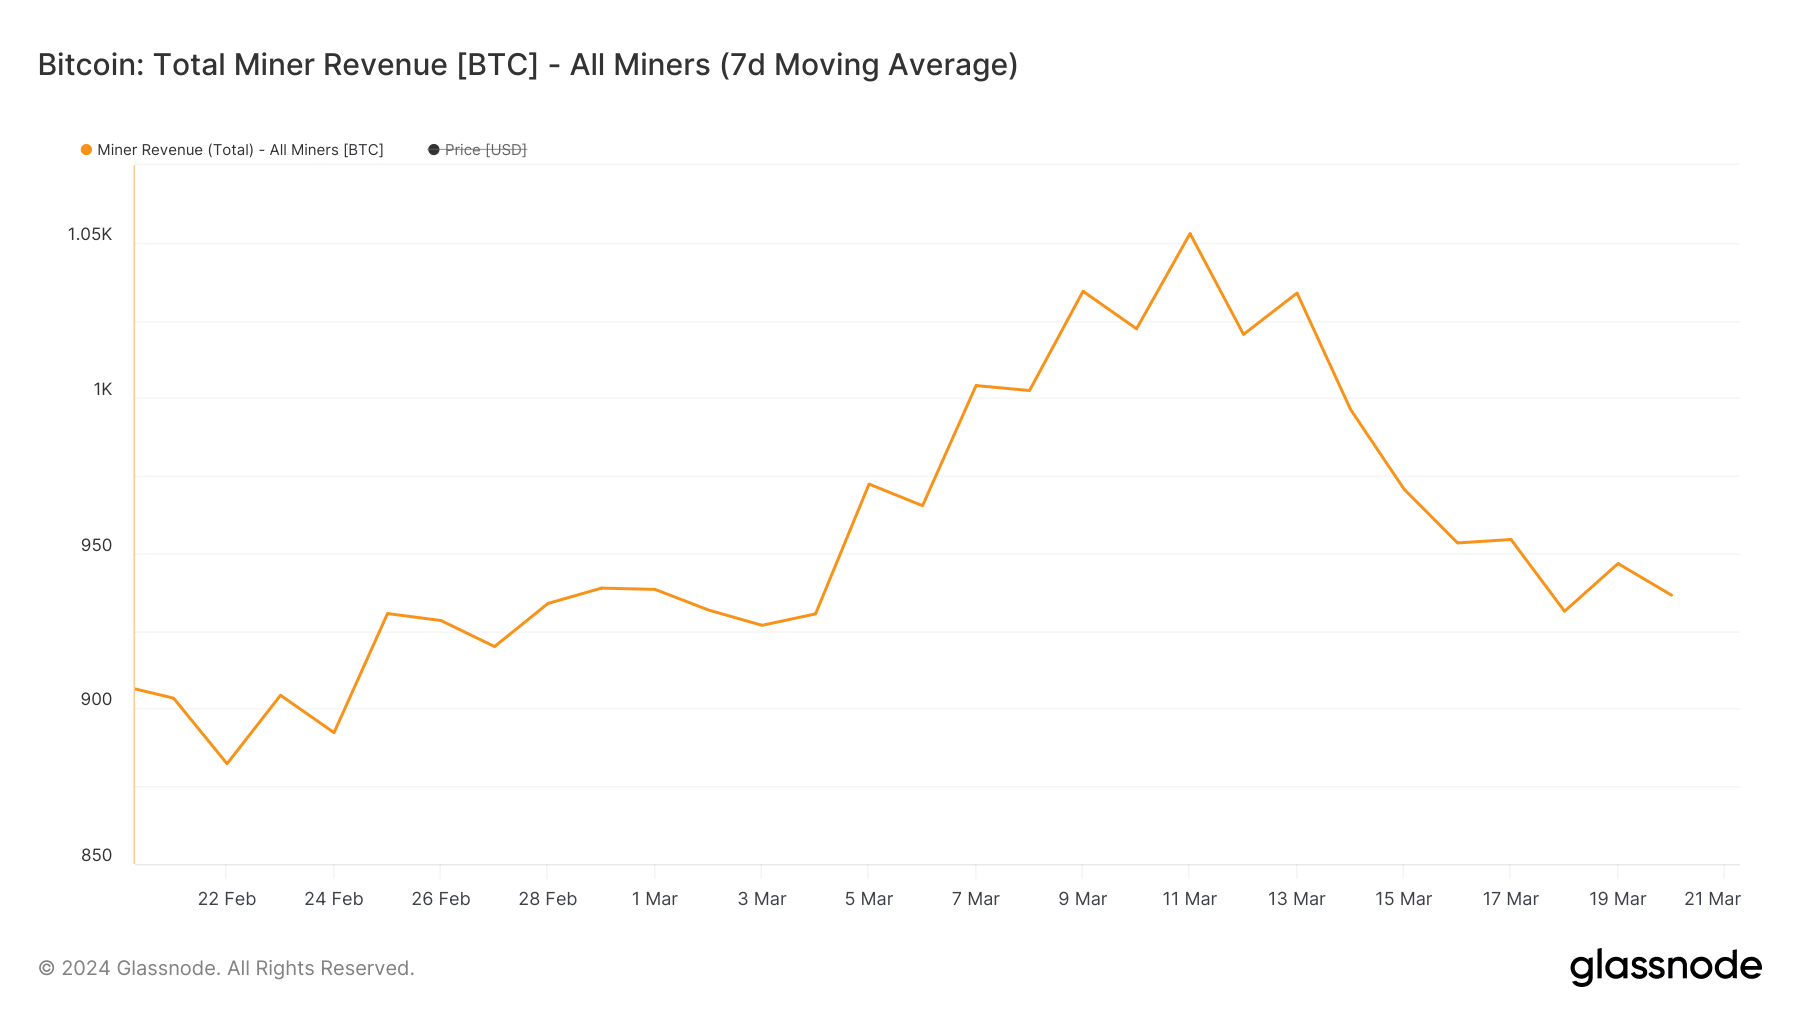
Miners have also distributed their holdings to cut losses, causing their reserve to plunge to a three-year low. The recent decline in BTC’s price has led to a steady decrease in miner revenue from fees, making coin distribution a more suitable option for network miners.
Per Glassnode’s data, the percentage of miner revenue derived from fees has declined by 44% since 6th March.

Source: Glassnode
Additionally, in the coin’s futures market, its open interest witnessed a 14% decline between the 15th and 20th of March, according to Coinglass’ data.
When an asset’s open interest falls in this manner, it suggests a decrease in the number of outstanding contracts. This is because market participants are exiting their positions without opening new ones.
As of this writing, BTC’s futures open interest was $36 billion.
Expect further drawbacks?
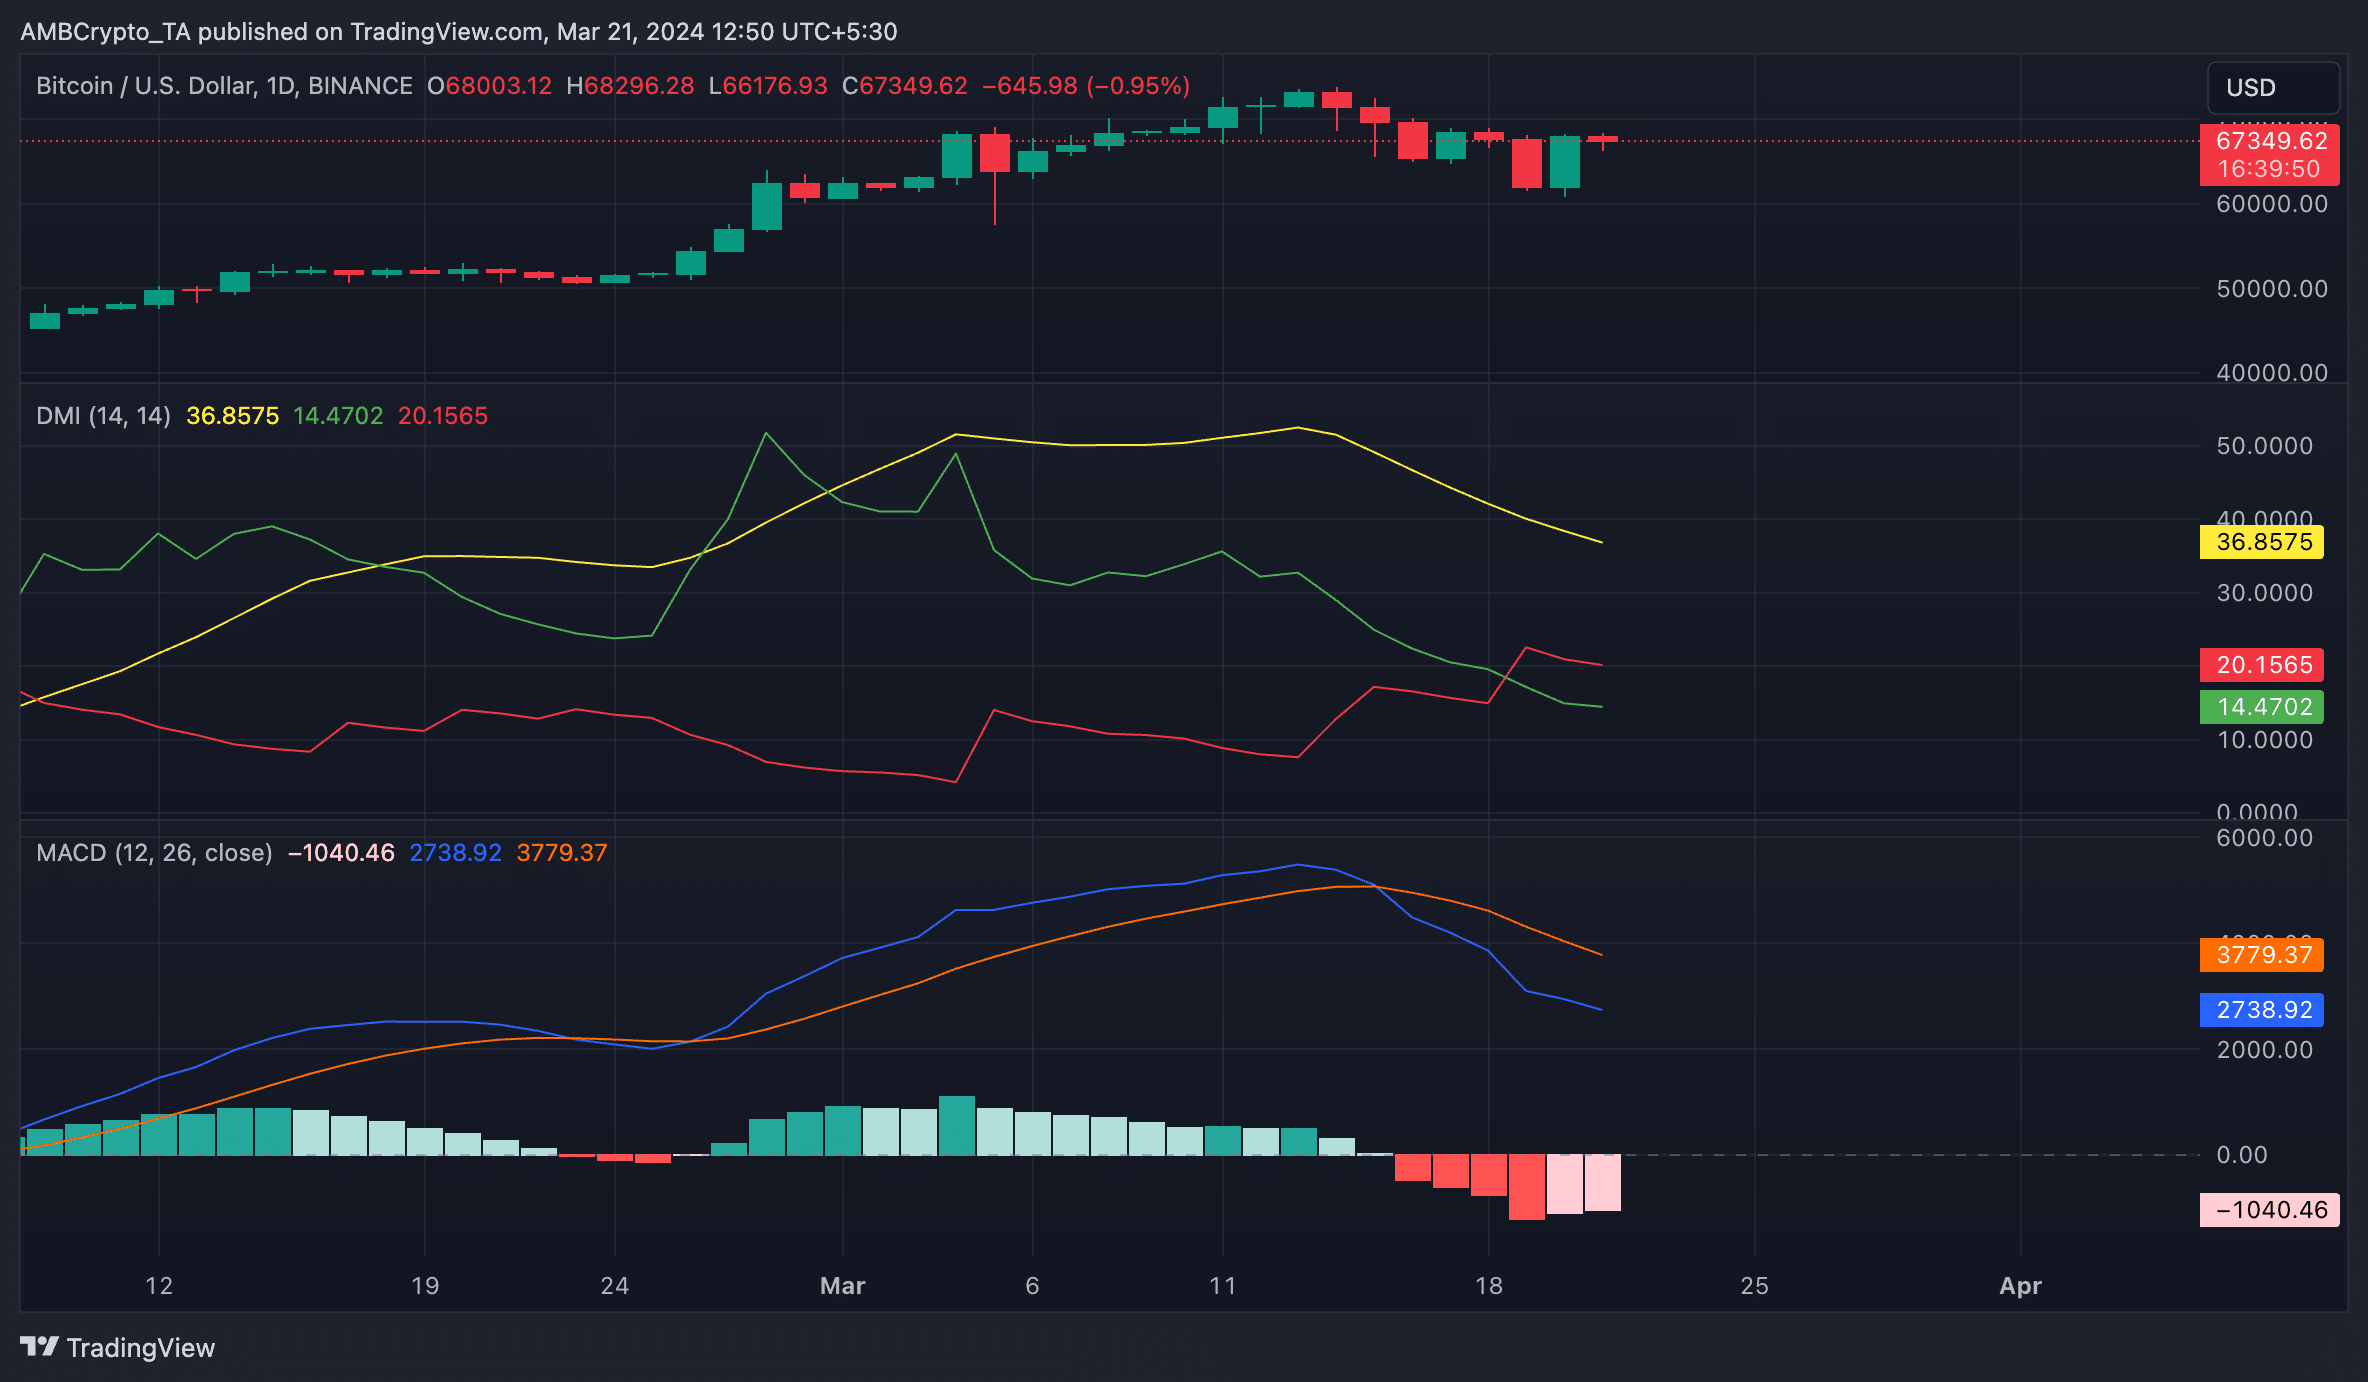
An assessment of BTC’s price movements on a daily chart revealed that bearish sentiment has become significant in the market.
Readings from the coin’s Moving Average Convergence Divergence (MACD) showed that its MACD line crossed below the signal line on 15th March, causing the indicator to return only red bars.
The intersection often suggests that an asset’s short-term momentum is weakening relative to the longer-term momentum.
Realistic or not, here’s BTC’s market cap in ETH terms
This crossover signals a shift towards bearish momentum and is interpreted by traders as a signal to consider selling or entering short positions.
Also, BTC’s positive directional index (green), at 14.70, rested below its negative index (red), confirming that the bears had regained control of the market.

Source: TradingView


