
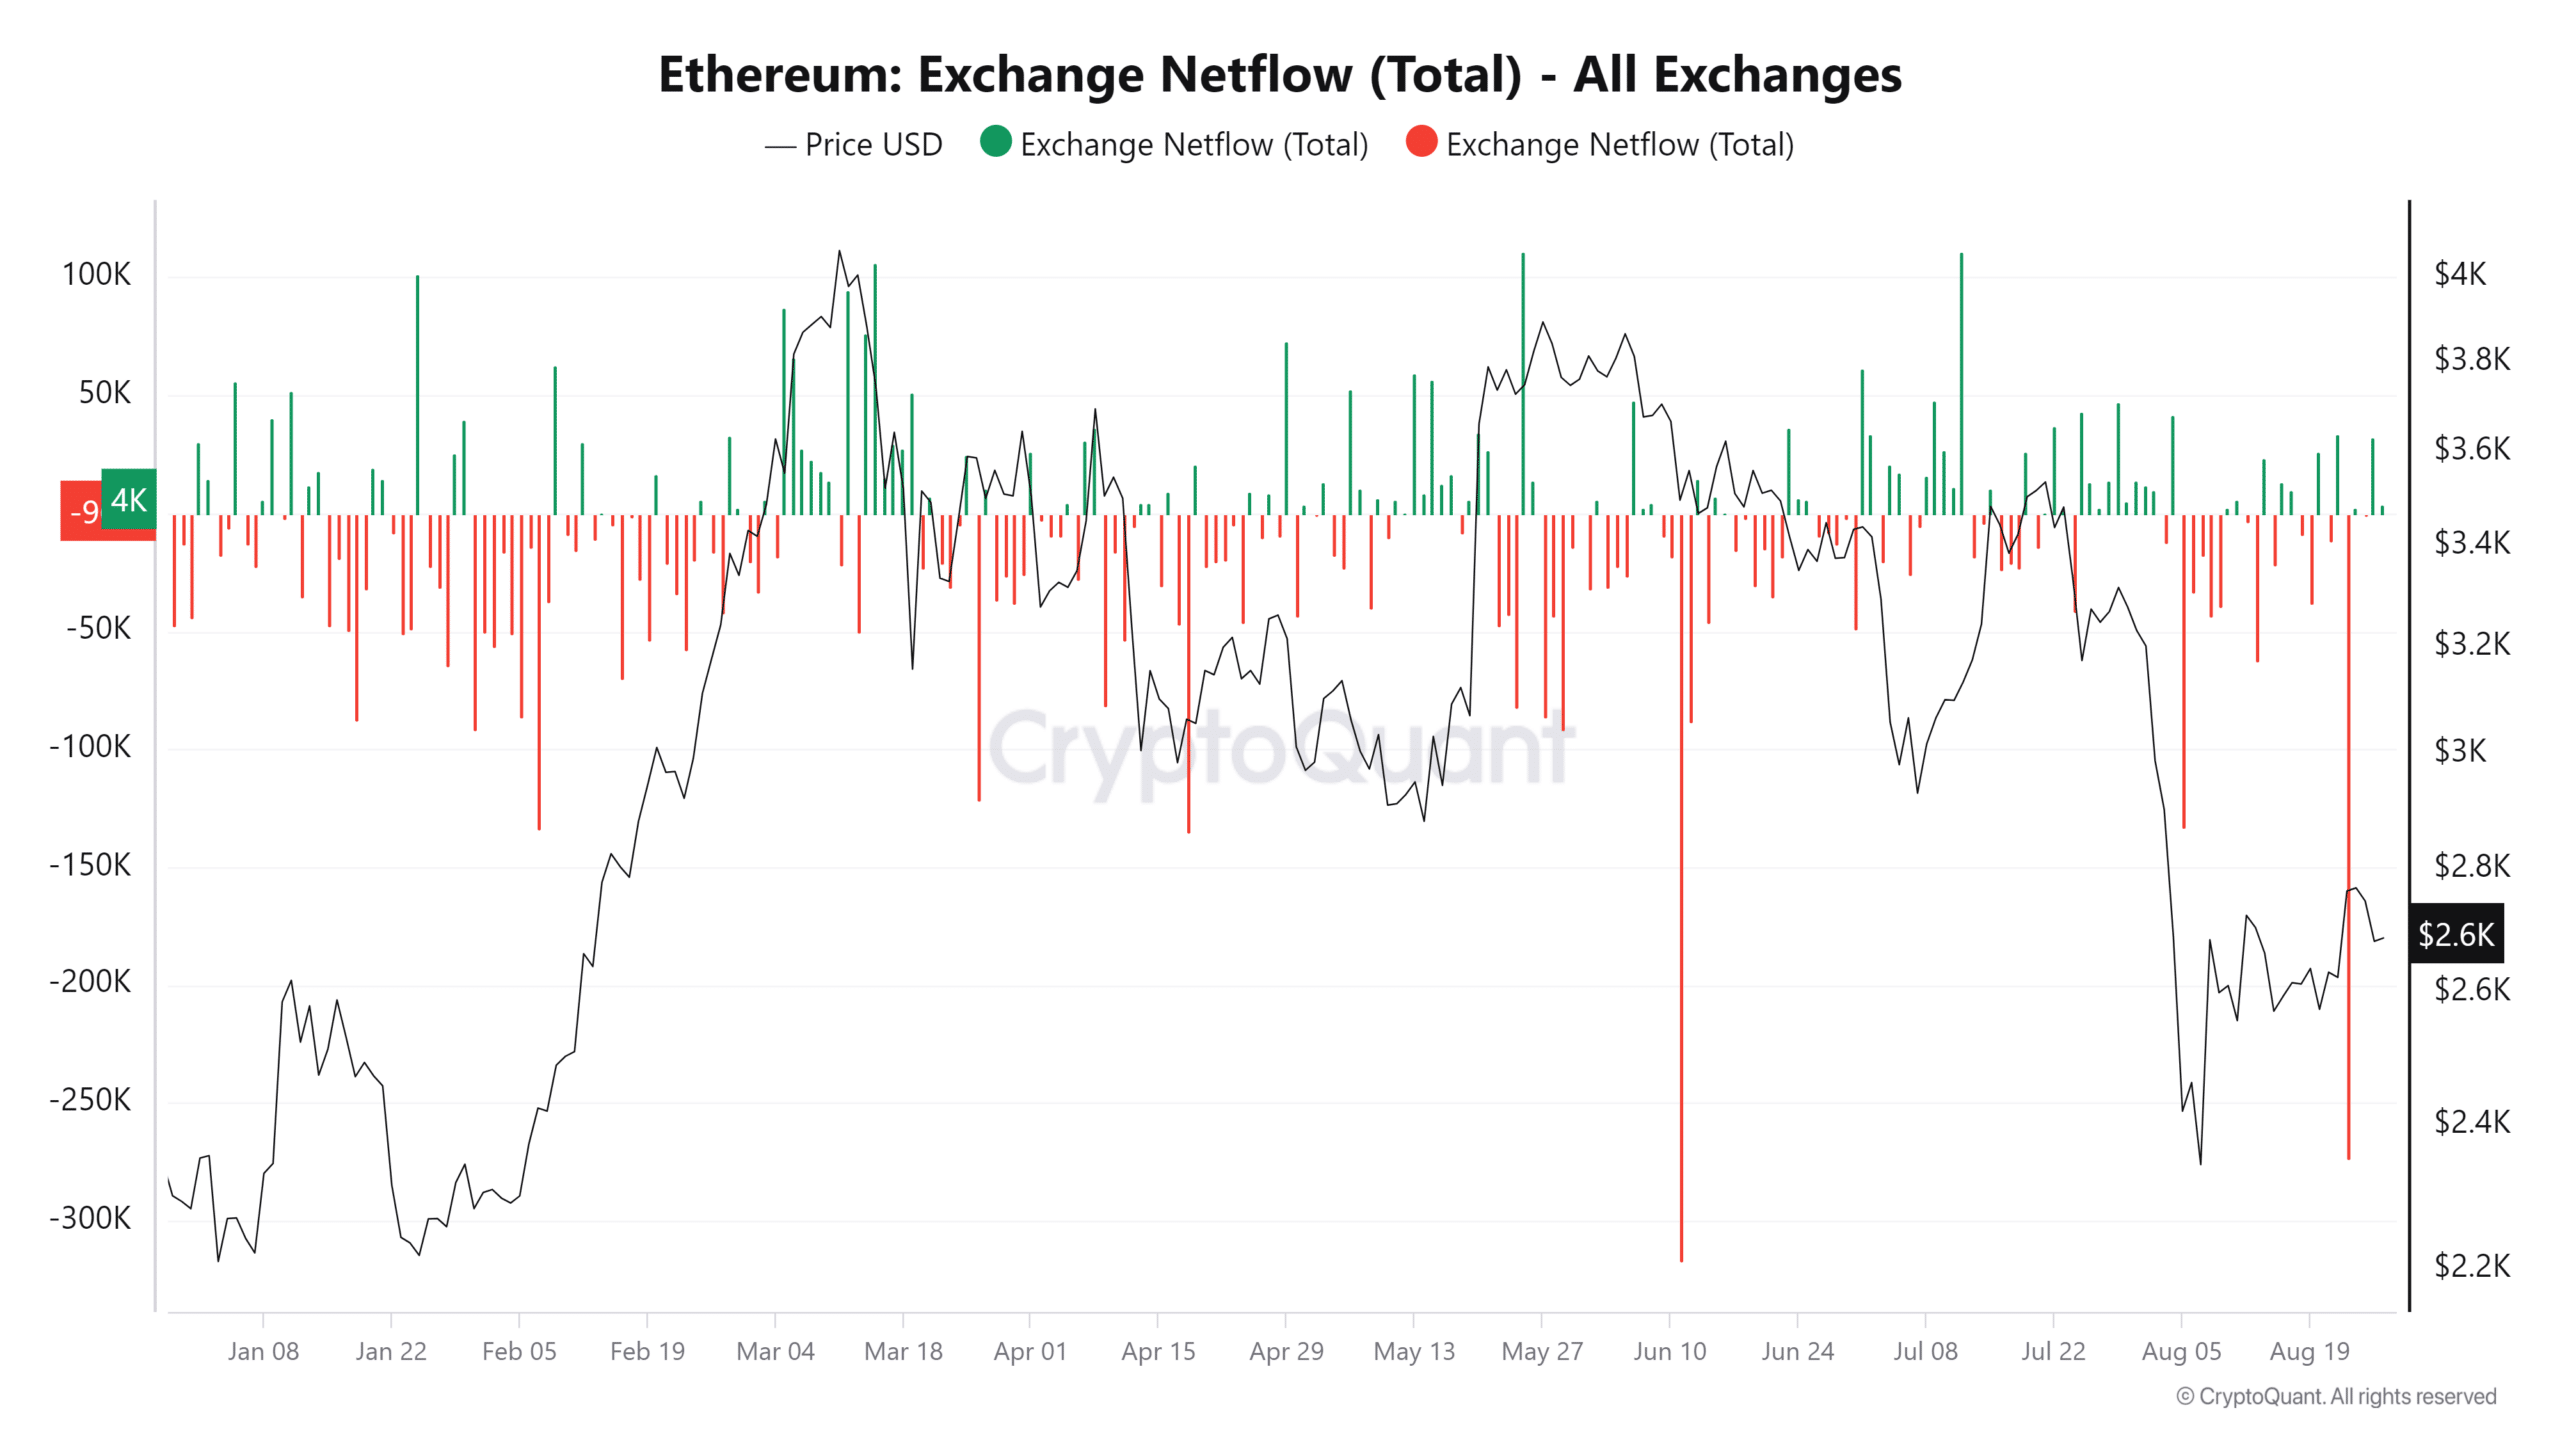
- ETH saw more inflow into exchanges in the last trading session.
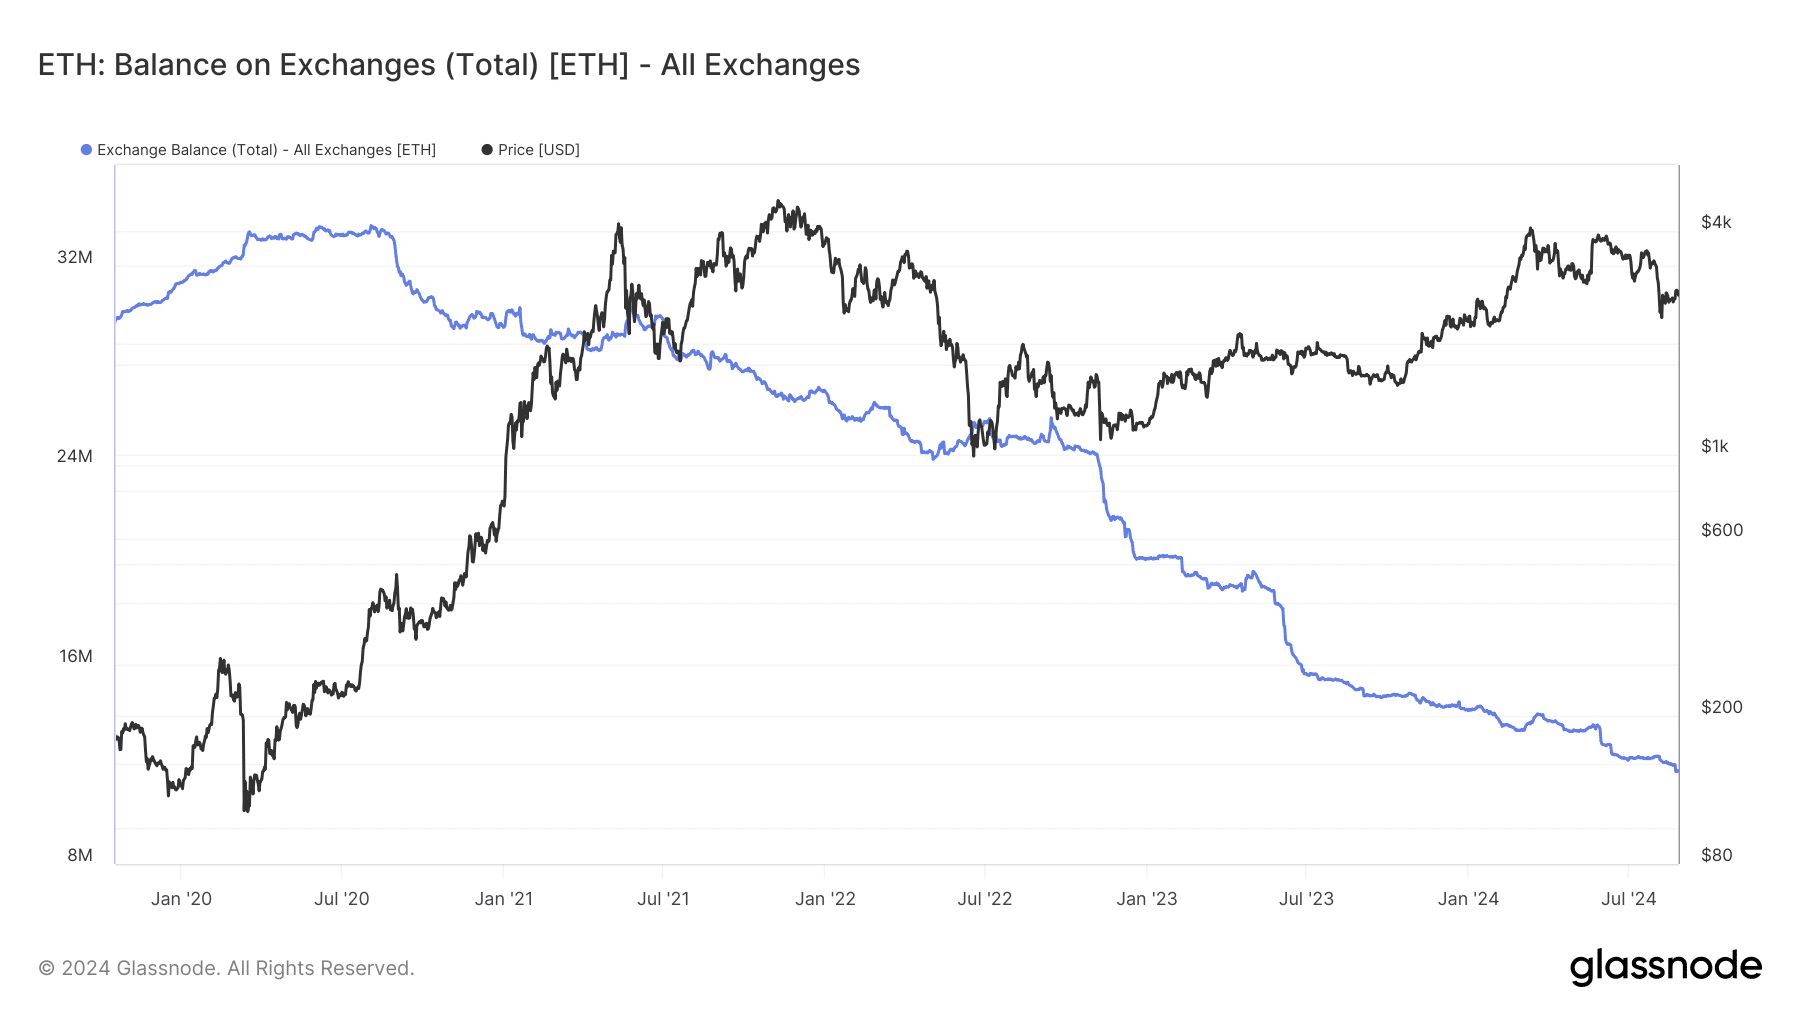
- The ETH balance on exchange has continued to decline.
A recent analysis of Ethereum’s [ETH] market activity revealed a pattern of accumulation and sell-offs by different addresses over the last few days.
Despite these mixed trends, the overall volume of ETH on exchanges has decreased, which is often a bullish signal.
Ethereum sees mixed signals
The recent Ethereum market activity has produced mixed signals from key indicators. On one hand, there has been notable accumulation by some large holders, or “whales,” which is typically a bullish sign.
Analysis of holders’ data shows that these whale addresses have increased their holdings by approximately 200,000 ETH, equivalent to around $540 million.
On the other hand, some institutional players have been selling, which could indicate a more cautious or bearish outlook from certain market participants.
Data from Lookonchain revealed that institutions like Amber Group and Cumberland have sold over 13,000 ETH, worth more than $35 million, in the last 24 hours.
This selling pressure from institutions contrasted with the accumulation by whales, creating a mixed market sentiment.
While the whale accumulation points to a strong belief in Ethereum’s future, the institutional sell-offs could reflect concerns about short-term price movements or broader market uncertainties.
Ethereum flow shows the dominance of sellers
AMBCrypto’s analysis of Ethereum’s exchange netflow data from CryptoQuant on the 26th of August revealed a positive netflow.
This indicated that more ETH was deposited into exchanges than was withdrawn on that day. Specifically, the netflow was over 32,000 ETH, suggesting that the volume of sell-offs outpaced the accumulation during this period.
Source: CryptoQuant
A positive netflow typically signals that investors are moving ETH onto exchanges, possibly to sell or trade, which can create short-term selling pressure.
This aligned with the recent data showing that some institutions, such as Amber Group and Cumberland, have been selling significant amounts of ETH.
However, despite this temporary increase in exchange inflows, the broader trend over the last few weeks has seen more outflow of ETH overall.
This means that, on a longer timescale, more ETH has been withdrawn from exchanges than deposited, often interpreted as a bullish indicator.
ETH’s exchange flight
The ongoing decline in Ethereum’s balance on exchanges is a significant trend, indicating that more investors are withdrawing their holdings from exchanges.
This reduction in exchange balance suggested that investors may be moving their ETH to cold storage, staking, or other forms of long-term holding, rather than keeping it readily available for trading.
Source: Glassnode
A declining exchange balance can lead to scarcity in the available supply of ETH on exchanges, which typically has a bullish implication for the asset’s value.
When fewer coins are available for trading, and if demand remains strong or increases, scarcity can drive up prices due to the basic economic principle of supply and demand.
This declining exchange balance adds to the list of bullish indicators for Ethereum, despite the mixed signals observed in recent weeks.
ETH continues to trend weakly
According to AMBCrypto’s analysis, Ethereum has recently struggled to maintain positive momentum.
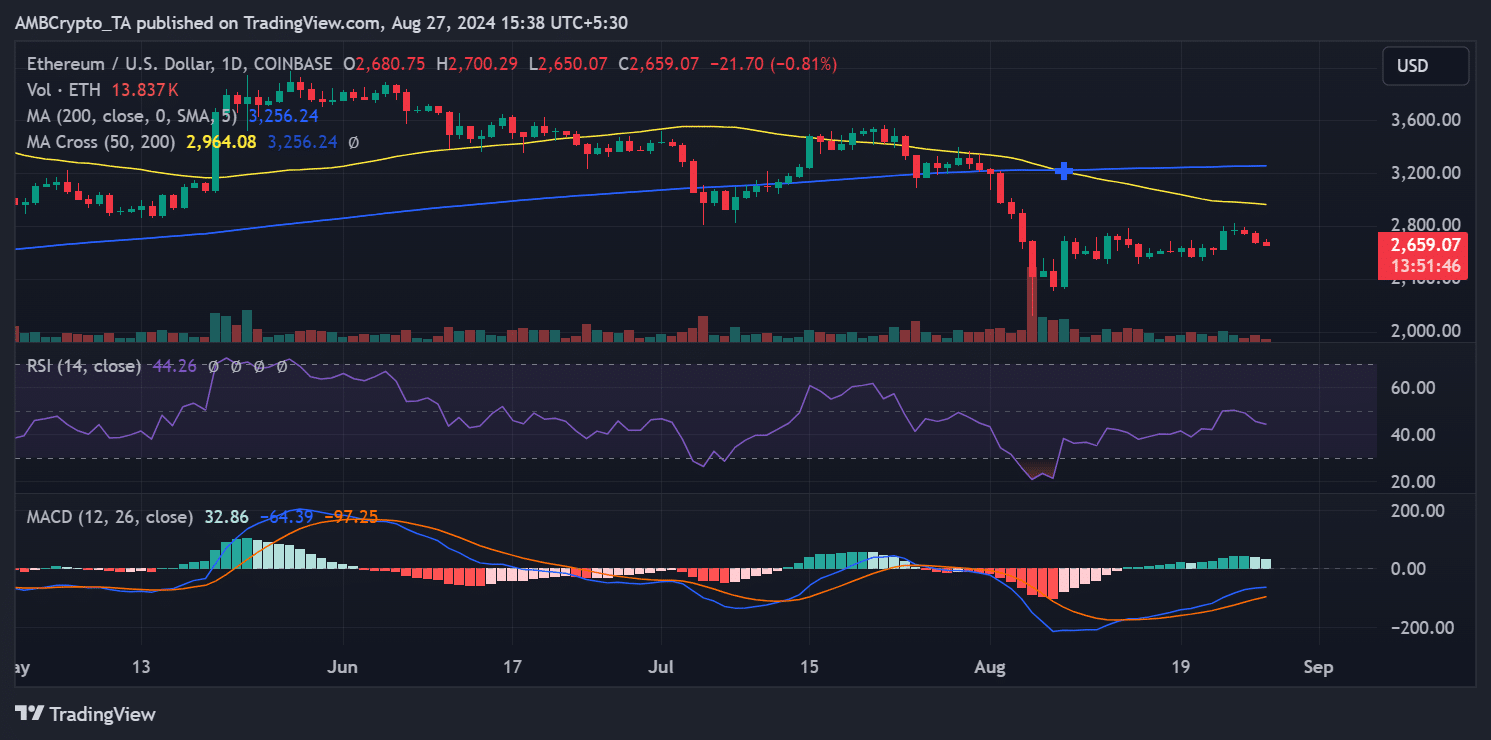
Its daily price trend analysis reveals that Ethereum has experienced consecutive declines over the last three days. As of this writing, Ethereum traded at approximately $2,656, reflecting an additional decline of nearly 1%.
Source: TradingView
Its short-moving average (yellow line) continued to act as a significant resistance level around $2,900.
Read Ethereum’s [ETH] Price Prediction 2024-25
This resistance has repeatedly prevented Ethereum from breaking higher, contributing to the recent downward pressure on its price.
The continued decline in price underscores the mixed signals that have characterized Ethereum’s market activity in recent weeks, with short-term bearish trends contrasting with some longer-term bullish indicators, such as declining exchange balances.







