
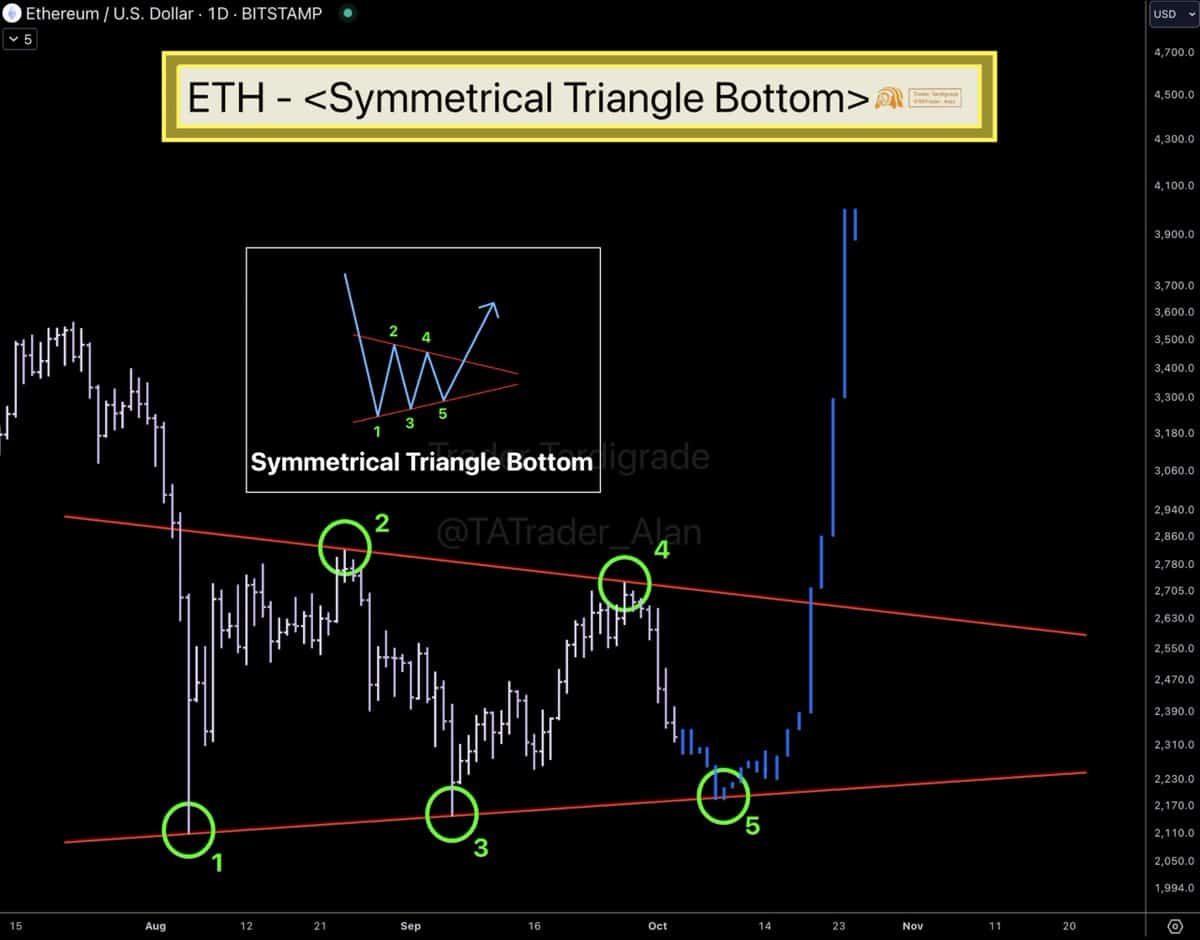
- Ethereum symmetrical triangle pattern could indicate a bottom formation, with potential for further declines before a rally.
- Increased leverage ratio and fluctuating open interest volumes suggest significant market movement.
Ethereum [ETH] has recently experienced significant volatility, with its price dipping by 10.8% over the past week. After a strong rally that pushed the asset above $2,700 in an attempt to reclaim the $3,000 level, the market corrected, sending Ethereum downwards.
As of now, it has begun showing signs of recovery, gaining around 2.4% in the past day to trade at approximately $2,389. This price movement has led many to speculate on the asset’s next potential trajectory.
Further decline before a surge
Notably, a prominent crypto analyst, known as Trader Tardigrade, shared insights on Ethereum’s potential price movement on X.
According to the analyst, Ethereum might be forming a “Symmetrical Triangle Bottom,” a technical pattern that suggests a possible reversal.
Source: Trader Tardigrade
However, the analyst emphasizes that ETH might first have to dip lower before any significant upward movement.
He noted, “It’s possible that ETH touches the lower support as the leg number 5 before it completes the Bottom formation,” pointing towards a likely pullback before the formation concludes.
For context, a symmetrical triangle pattern in technical analysis is a chart formation where the price consolidates into a tighter range as time progresses, creating a shape resembling a triangle.
This pattern often indicates a period of indecision in the market, as buyers and sellers compete to take control. The symmetrical triangle is characterized by a series of lower highs and higher lows, converging at a point known as the apex.
When this formation concludes, it often leads to a breakout in either direction — either upwards or downwards — signaling the start of a new trend.
In Ethereum’s case, the symmetrical triangle formation being observed suggests a period of consolidation before a decisive move. If the triangle pattern plays out as the analyst anticipates, Ethereum could potentially see a surge in price after touching its lower support.
Ethereum key metrics signal major market move
Beyond the technical patterns, it’s worth assessing Ethereum’s market fundamentals, which provide a broader context to its price behavior.
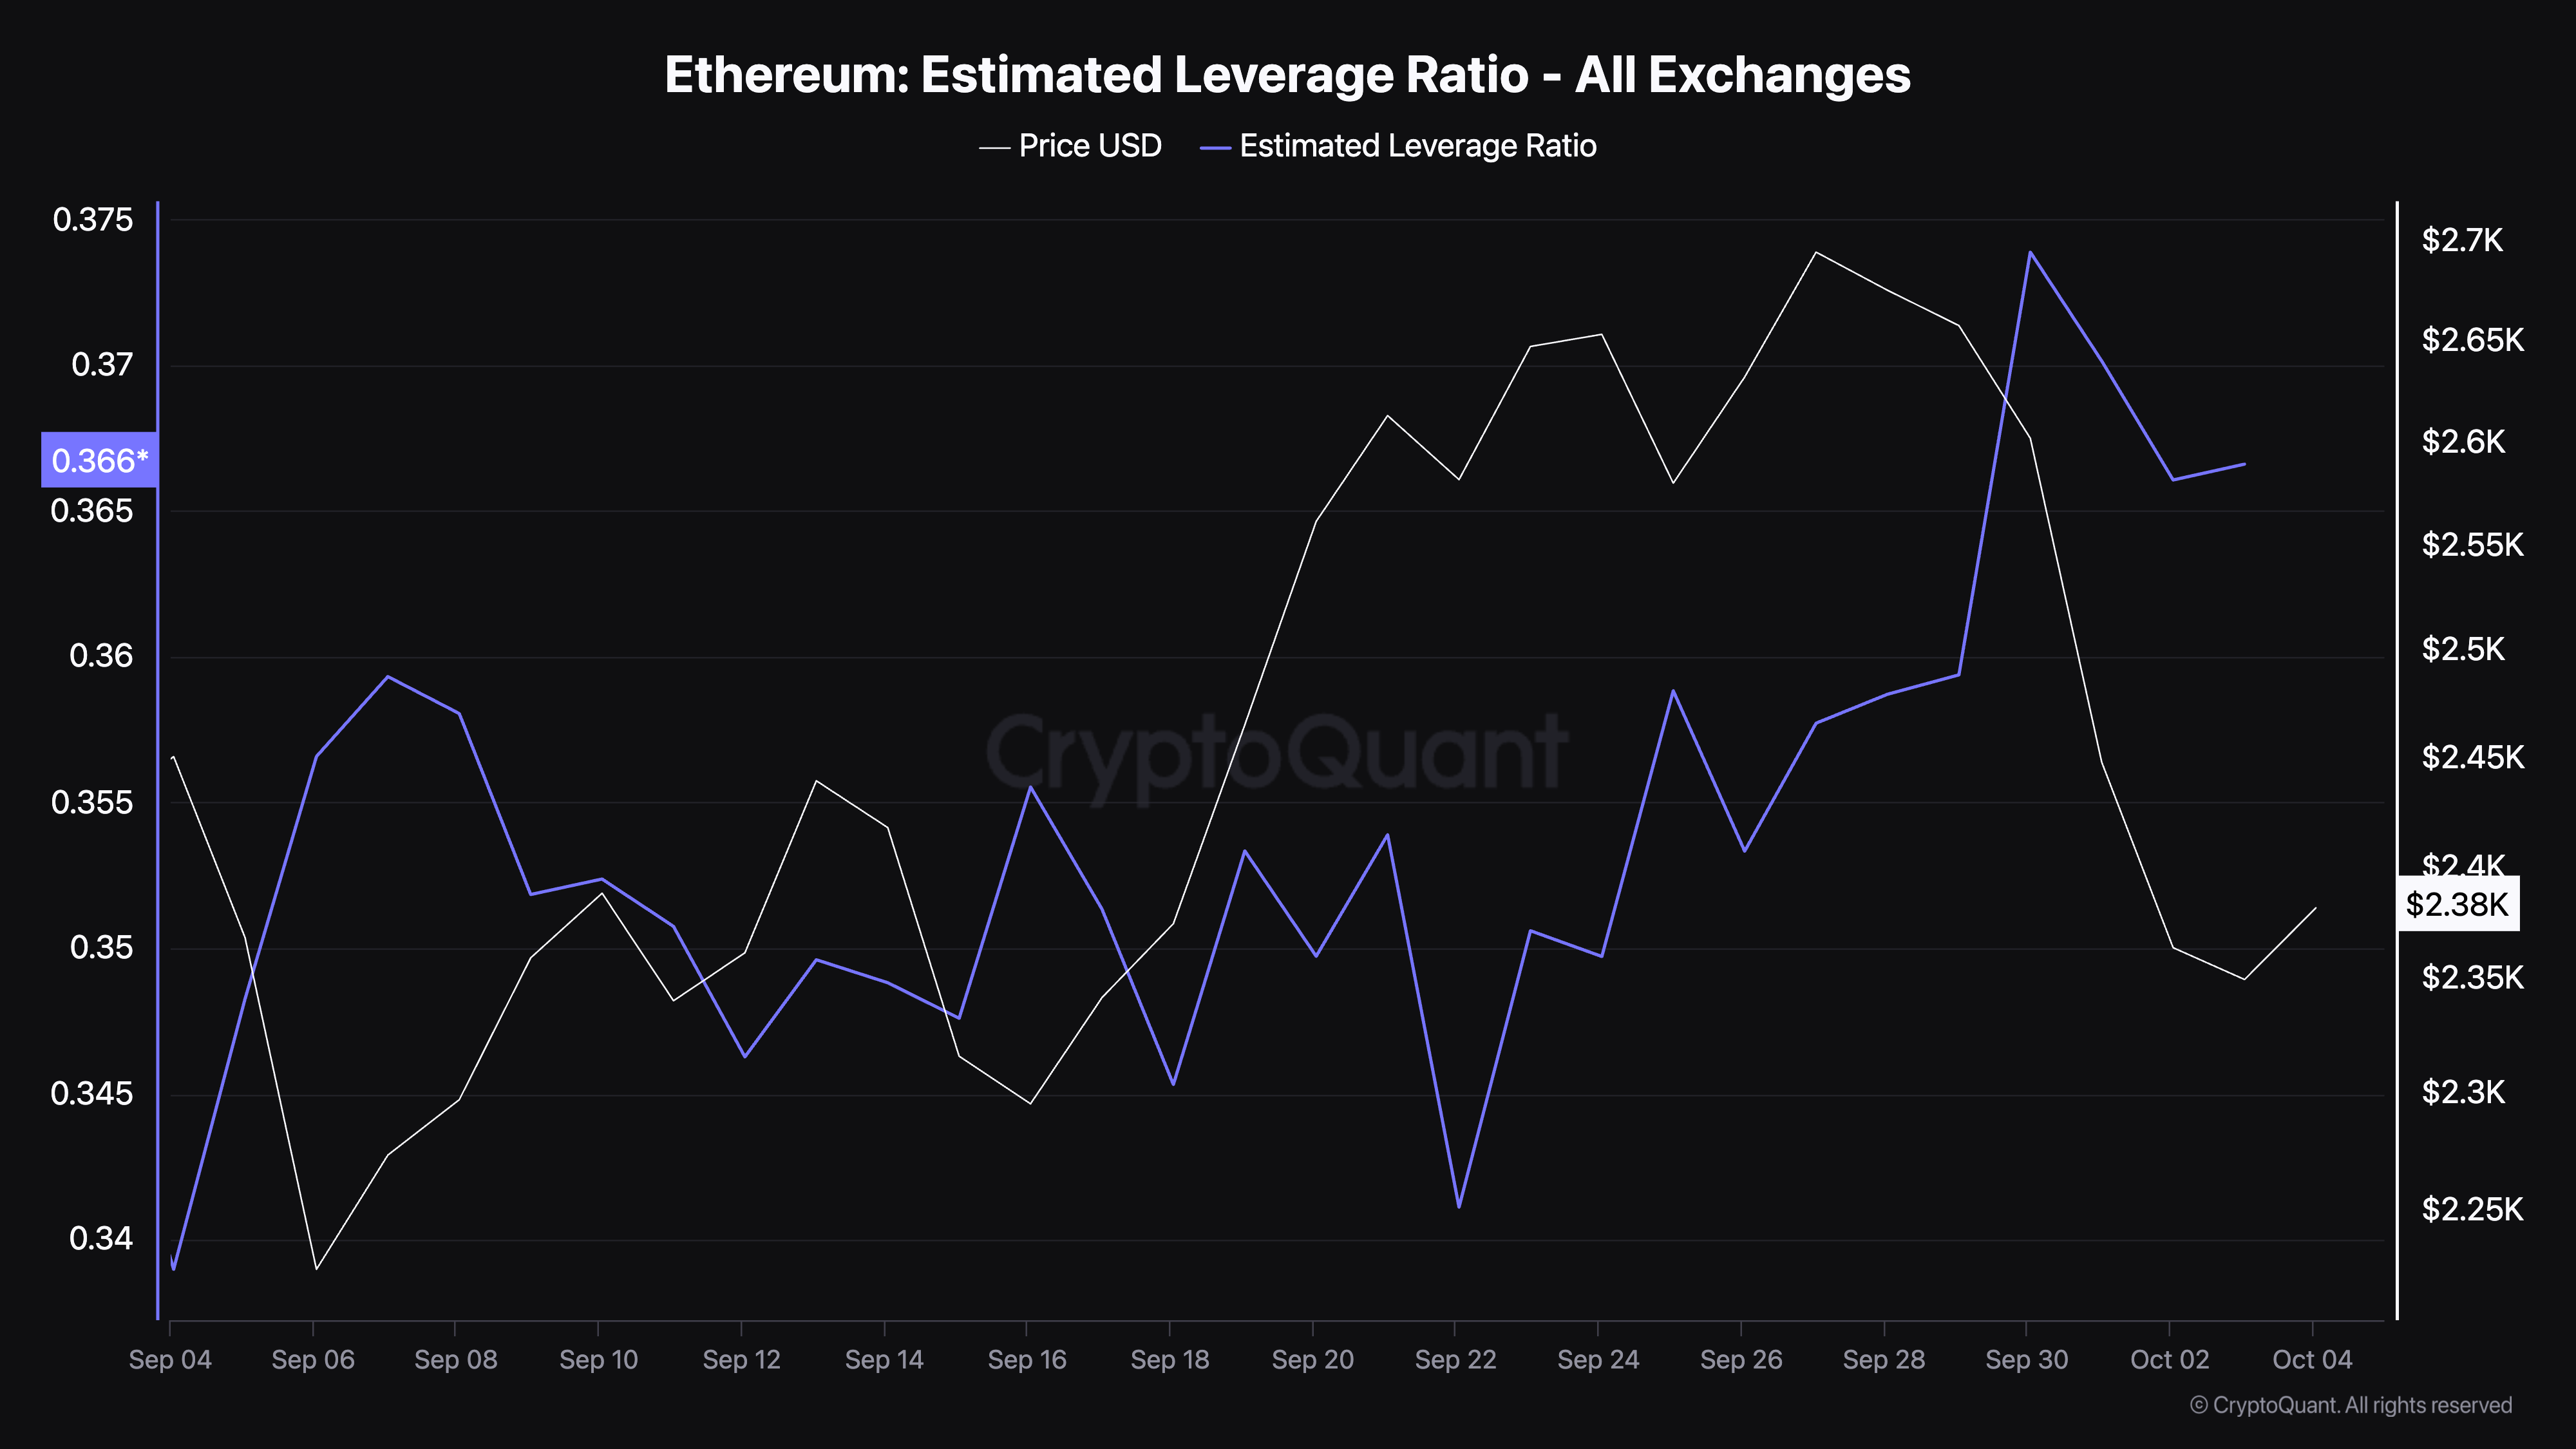
One key metric to observe is the “Estimated Leverage Ratio,” a measure that reflects the amount of leverage being used in the Ethereum market.
This ratio is calculated by dividing the open interest (the total number of outstanding derivative contracts) by the reserve of an asset on exchanges. A high leverage ratio suggests increased speculative activity, indicating that traders are using leverage to amplify their positions.
Currently, according to data from CryptoQuant, Ethereum’s estimated leverage ratio has risen from 0.341 at the end of last month to 0.366. This uptick suggests that traders are increasingly using leverage, potentially signaling heightened risk and volatility in the market.
Source: CryptoQuant
A higher leverage ratio can lead to more pronounced price movements. Leveraged positions are more susceptible to liquidations when the market moves against traders’ expectations.
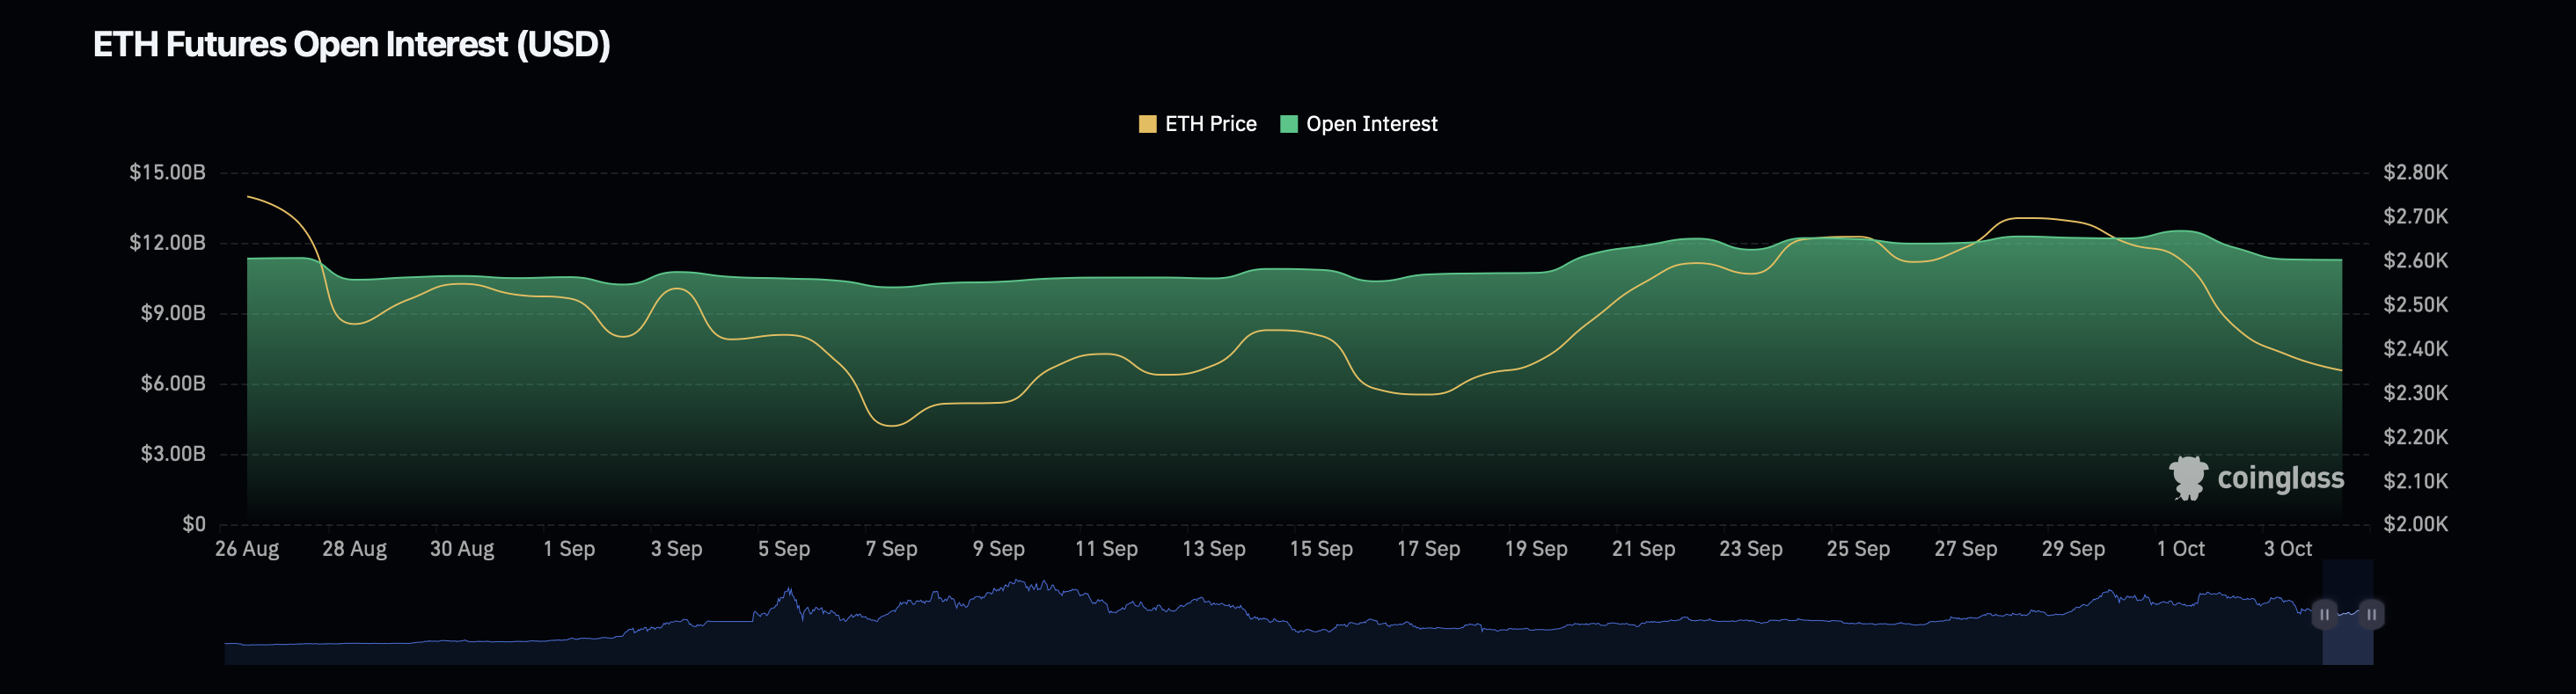
Additionally, Ethereum’s open interest data from Coinglass shows an increase of 0.81%, bringing the metric’s valuation to $11.44 billion. Open interest represents the total number of outstanding contracts in the derivatives market.
Source: Coinglass
Read Ethereum’s [ETH] Price Prediction 2024–2025
An increase in this metric can indicate a rise in speculative activity and market participation. Conversely, Ethereum’s open interest volume has decreased by 24.17%, now standing at $24.33 billion.
The divergence between open interest and volume could suggest a cautious market. Traders might be holding back from taking larger positions.







