
Disclaimer: The information presented does not constitute financial, investment, trading, or other types of advice and is solely the writer’s opinion.
Hedera saw enormous losses on the price charts in recent weeks. The rally in early 2023 was halted just below the $0.1 mark. Subsequent efforts to drive another rally were halted at $0.075. In April the higher timeframe market structure of HBAR shifted bearish. Keeping all these points in mind, here is an HBAR Price Prediction.
Read Hedera’s [HBAR] Price Prediction 2023-24
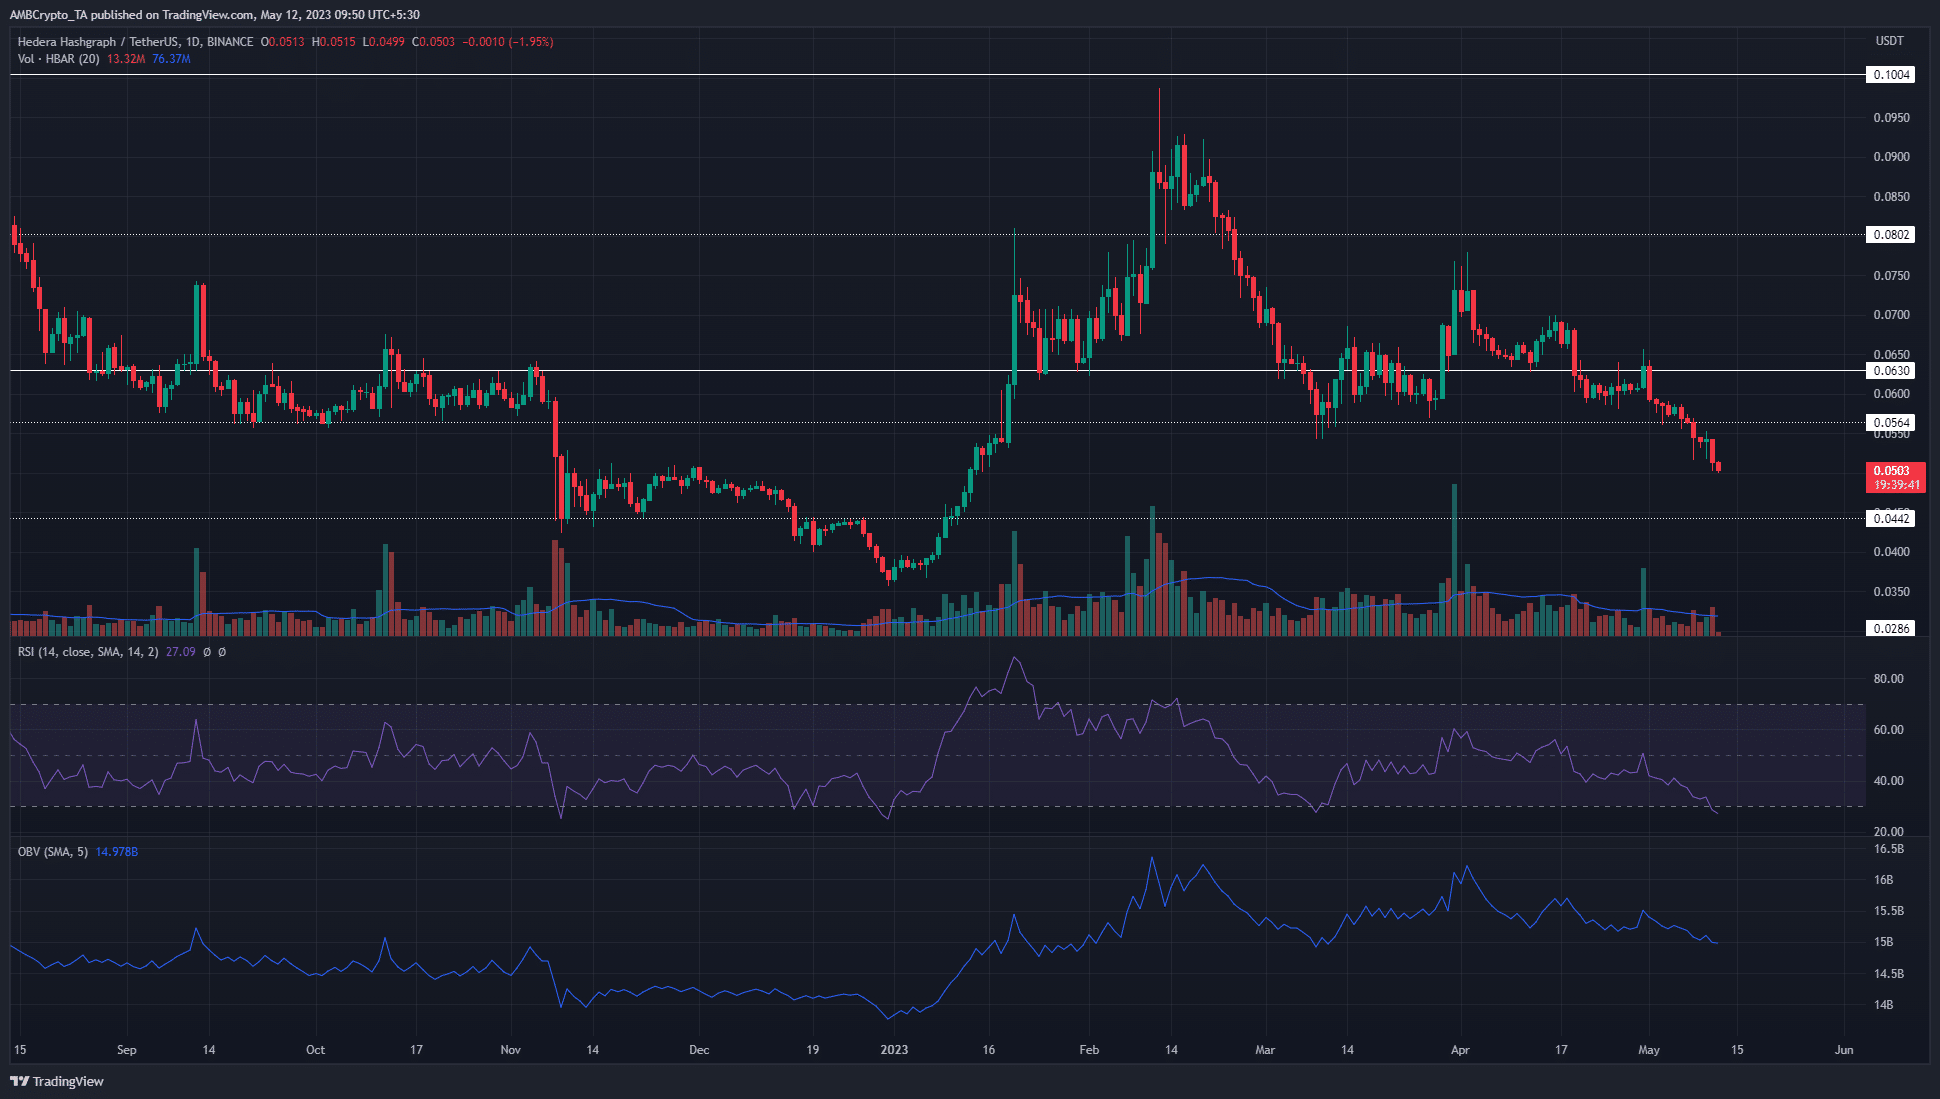
The price charts indicated further losses are likely in the coming weeks. Any bounce in prices can be considered a temporary respite before another leg south. Some important horizontal levels were identified, with $0.056, $0.05, and $0.044 being the closest to the market price of HBAR at press time.
Loss of $0.056 as support will hit the bulls hard

Source: HBAR/USDT on TradingView
The daily timeframe showed that like many altcoins across the market, early 2023 was a wonderful time to be a bull. Hedera posted gains of 177% in January when it rallied from $0.0356 to $0.0987. However, the price has been pointing south since then.
The retracement to $0.056 in March was seen as a healthy pullback. When Bitcoin rose to $30k in April, it appeared likely that Hedera would be able to push past the $0.075-zone as well. And yet, the crypto-markets did not see strength from the buyers.
Thereafter, HBAR plunged into a downtrend. This was made apparent when the $0.063-support was broken. The market structure flipped bearish as well, and it remained so at the time of writing.
How much are 1, 10, or 100 HBAR worth today?
The RSI fell to 27 to show enormous bearish pressure. However the OBV did not see huge losses. Instead, it continued to defend a support level from early February. This suggested selling volume might not be as expansive as the price charts showed and hinted at a possible recovery if the bearish market sentiment was arrested.
To the south, the $0.044-level was a higher timeframe support level that could see a bounce in HBAR prices. The $0.05-mark has been important as well. This was highlighted in November 2022 when HBAR bulls struggled to breach the $0.05-resistance.
Rising development activity gives investors hope

Source: Santiment
In mid-March, the total NFT trades saw an enormous spike, but the count has been in decline since. The development activity, on the other hand, has been rising since January. This was a positive sign for long-term investors.
The weighted sentiment has been in negative territory since mid-April. This coincided with HBAR’s rejection from $0.074 and retest of the $0.063-support.
Lower timeframes show stern bearish momentum as well

Source: HBAR/USDT on TradingView
The 2-hour chart showed that the lower timeframe market structure was also bearish. It highlighted the bulls’ attempts to hold on to the $0.056 support level in May. They were exhausted on 8 May and the swift move south left an imbalance around the $0.056-$0.056 area. The $0.53-$0.54 zone acted as support briefly but was ceded as well.
The Bollinger Bands were wide apart to reflect the volatility of the past two days. The price hugged the lower of the two bands, while the Awesome Oscillator noted red bars on its histogram over the last 24 hours.
The 2-hour charts found that $0.05 was previously tested as support back on 15 January. It halted the strong rally for a few hours but was eventually overpowered. This could be the case on the way down as well.

Source: Coinalyze
Data from Coinalyze revealed that speculators were extremely bearish on HBAR. On 11 May, when the prices fell past the $0.052-mark, the Open Interest rose by close to $8 million. On 9 and 10 May, Futures traders had been quiet and sentiment did not favor the sellers as strongly as it did on Thursday.
The spot CVD also took a nosedive on 11 May, reflecting intense selling pressure once again. Taken together, the lower timeframe charts and sentiment were bearish. However, it is possible that the $0.05-level could see a minor bounce in HBAR prices before another move south.







