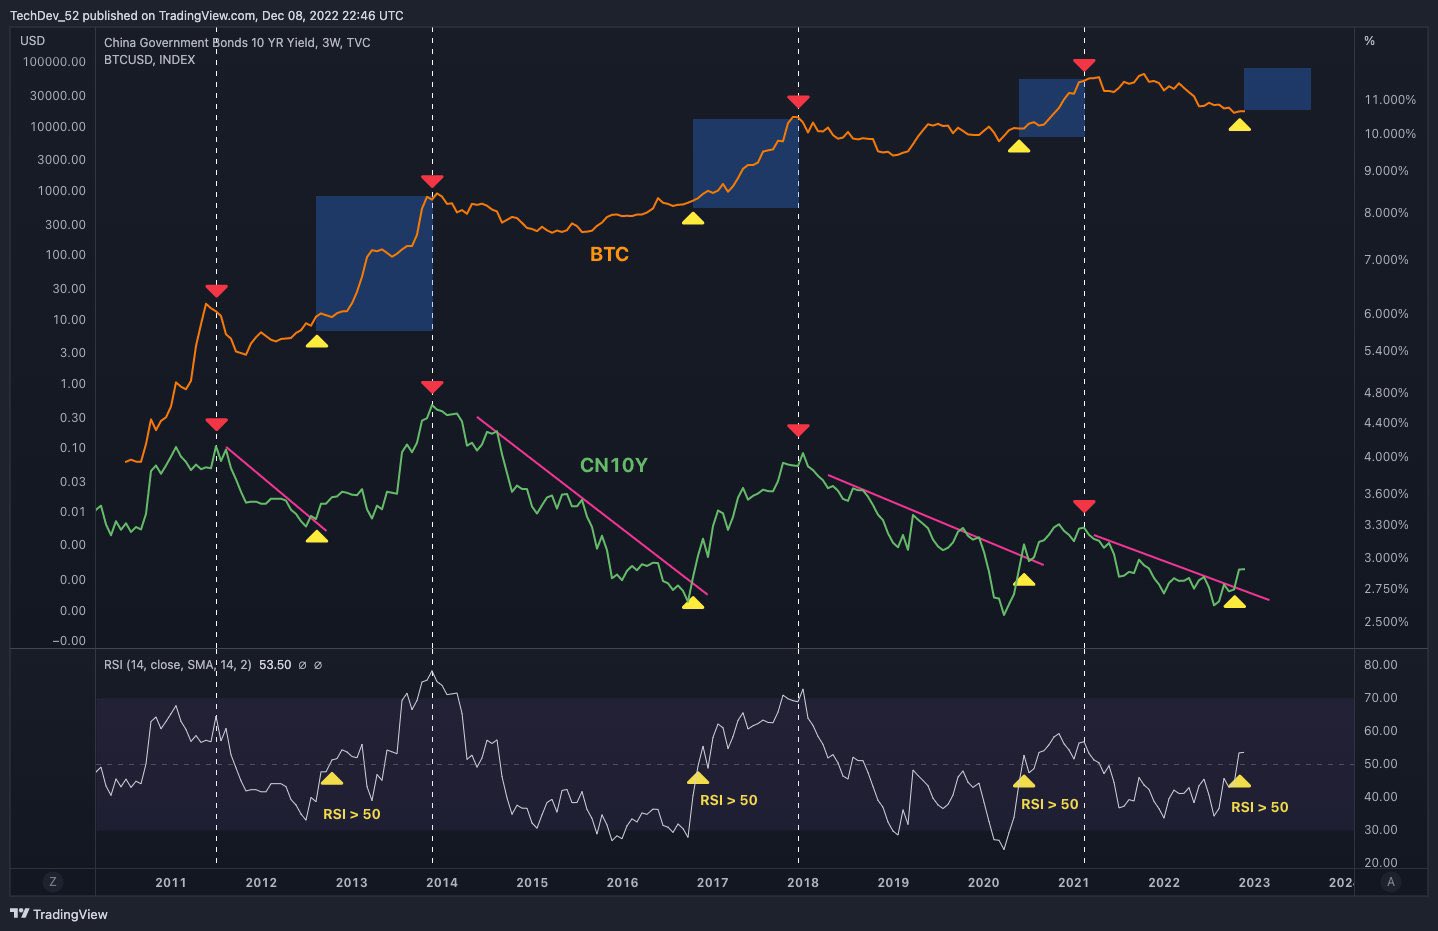
Bitcoin (BTC) may be on track for some explosive moves to the upside if its current setup is anything similar to its market structure of November 2020, according to a widely followed crypto analyst.
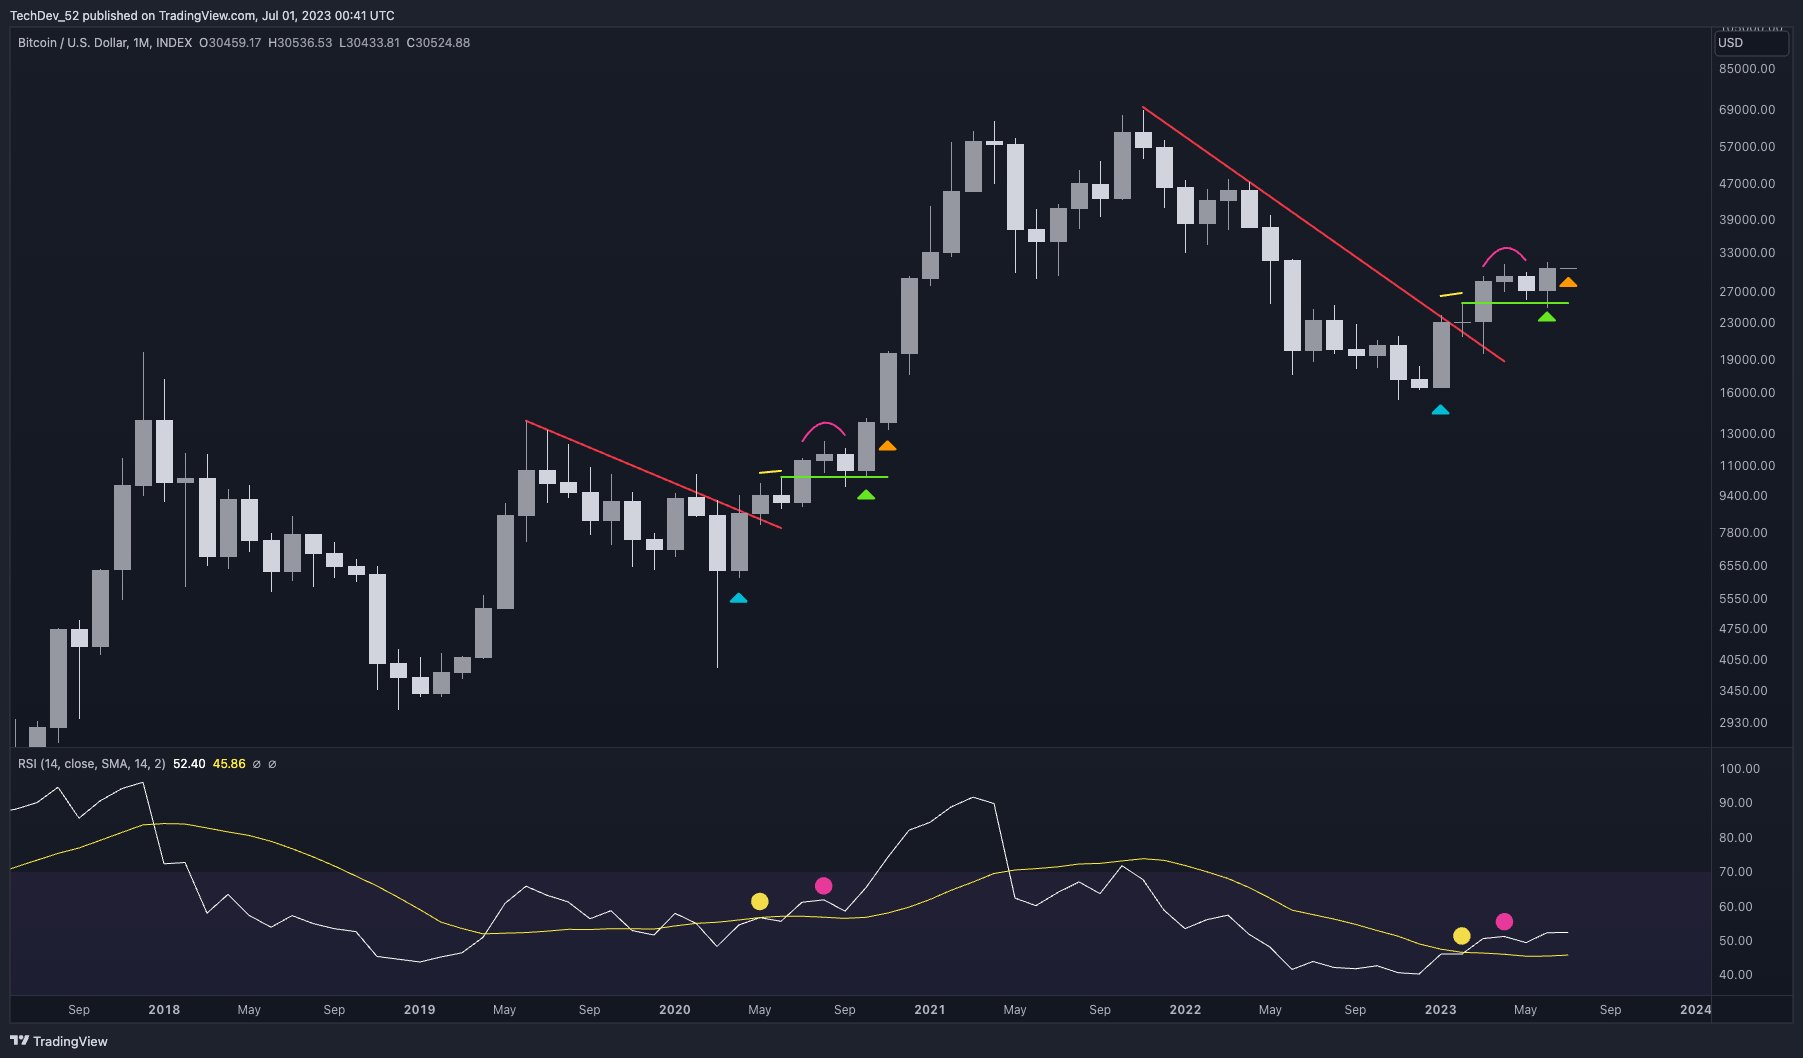
Pseudonymous analyst TechDev tells his 413,000 Twitter followers that BTC appears to be mirroring its November 2020 price action, though it remains to be seen if the same pattern plays out again.
TechDev’s chart suggests that BTC is currently flashing three technical signals that are reminiscent of its November 2020 market structure.
According to the chart, BTC has confirmed a breakout from a diagonal resistance after moving above it in January and retesting it in March. It also shows that Bitcoin is currently respecting a horizontal support after the crypto king bounced off of it late last month.
Looking at the relative strength index (RSI), the chart indicates that the momentum indicator crossed above its 14-month simple moving average (SMA), retested support and moved on up again.
The three signals also appeared in November 2020 before Bitcoin rallied from above $10,000 to $60,000 in a few months.
“Next, we’ll find out if July 2023 = Nov 2020. Bitcoin.”

The closely followed analyst says that while many market participants are making forecasts based on the traditional four-year cycle theory, he says something slightly more complex may be brewing instead.
“I remember when my belief in a predictable four-year heartbeat of blow-off tops that would make everyone rich, made me allergic to other interpretations.
Perhaps we are in the same macro impulse wave that began in 2019, and are seeing a similar early structure to the current sub-impulse as we did with the last (late 2020).
Or perhaps the four-year cycle (closer to 3.5 years) if there is one, is driven by liquidity, not the halving. Perhaps we are in the early stages of a parabolic leg, similar to late 2015/2016, and those who can’t look before 2019, won’t get ‘one more big dip.’”

Don’t Miss a Beat – Subscribe to get email alerts delivered directly to your inbox
Check Price Action
Follow us on Twitter, Facebook and Telegram
Surf The Daily Hodl Mix
Generated Image: DreamStudio


