- The ETH/BTC pair is trading within a bullish pattern on the monthly timeframe, which could influence a positive price movement.
- Buying activity is gaining momentum as more traders adopt a bullish outlook.
Ethereum’s [ETH] recent performance has been lackluster. After reaching a high of $4,100 on 2nd December, ETH quickly lost 20.13%, falling to $3,200 per Trading View. This sharp decline suggests a persistent selling pressure in the market.
Despite the selling activity, a new bullish pattern has emerged—a high-probability setup implying that sellers may soon lose dominance as buyers step in to drive prices higher.
High-probability setup emerges: Will ETH rally soon?
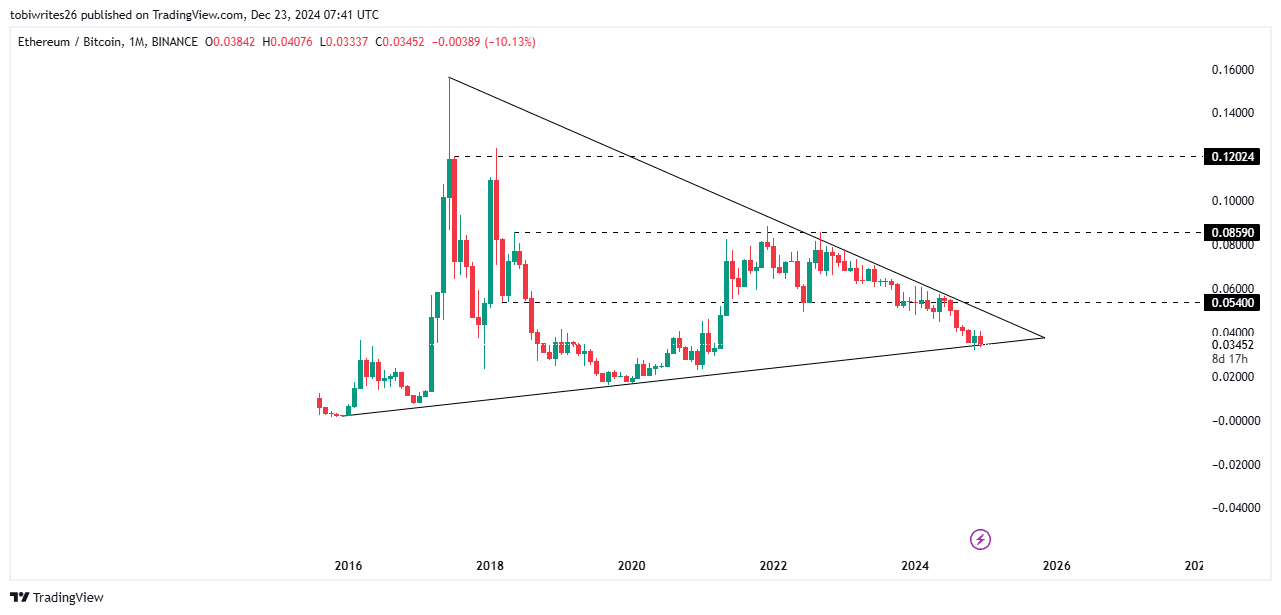
The ETH/BTC pair is showing signs of a potential rally with the formation of a high-probability setup. A symmetrical triangle pattern has emerged, with the price oscillating between converging support and resistance levels.
The appearance of this pattern on the monthly timeframe strengthens the likelihood of an upward breakout.
Currently, the price is trading near the bottom of the pattern, at the support level, signaling the possibility of a significant upward move.
If this pattern plays out, ETH could rally, with three key levels to watch: 0.0540, 0.0859, and 0.1202. This suggests it may become increasingly expensive to buy 1 ETH with BTC.

Source: Trading View
As ETH/BTC trends higher toward these levels, it will also positively impact the ETH/USDT price, which is currently trading at $3,200. If the rally materializes, ETH has the potential to reclaim its previous highs around $4,000 and trend further high.
Sellers are losing steam
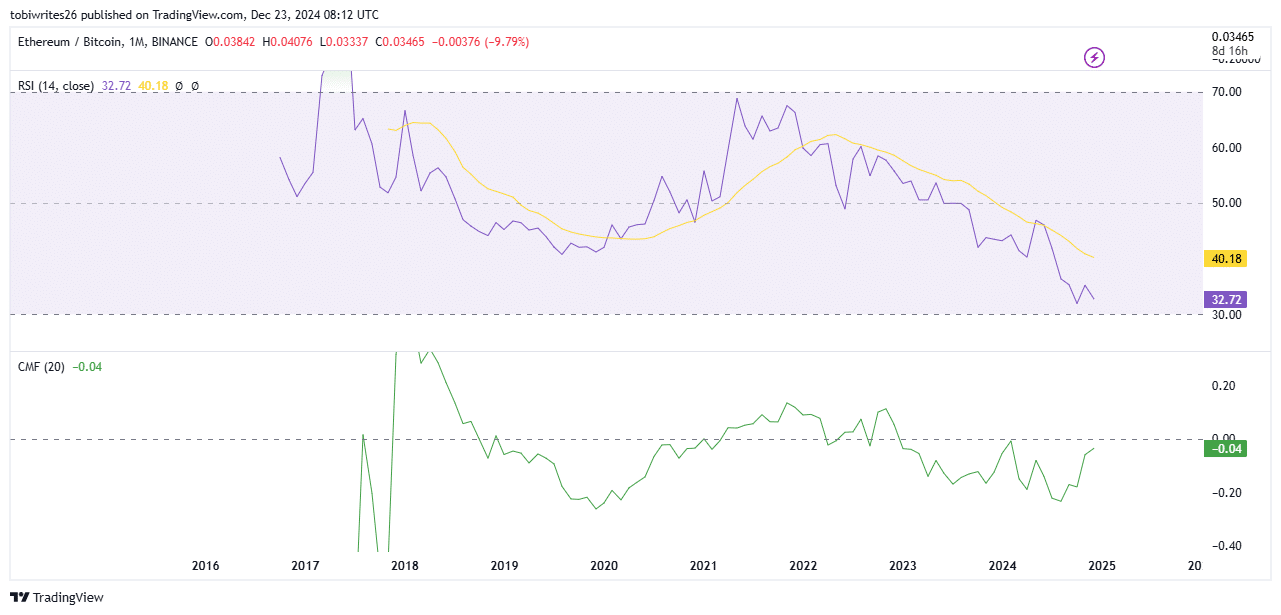
Sellers in the market appear to be losing their dominant momentum. The Relative Strength Index (RSI), which had been trending downward for months, is now approaching the oversold region with a current reading of 32.19.
When an asset nears the oversold zone (marked at 30), it indicates that selling pressure is diminishing, suggesting the possibility of renewed buying activity. If this trend holds, ETH’s price could rise, becoming more expensive as demand increases.

Source: Trading View
The fading selling pressure is further confirmed by the Chaikin Money Flow (CMF) indicator, which is beginning to push higher and is trending back toward positive territory.
The CMF measures the balance of buying and selling pressure in the market. A shift toward the upside suggests that buyers are regaining control, with their volume surpassing that of sellers.
This upward movement could strengthen ETH’s price, signaling a potential market reversal and an increase in asset value.
Accumulation spree for ETH
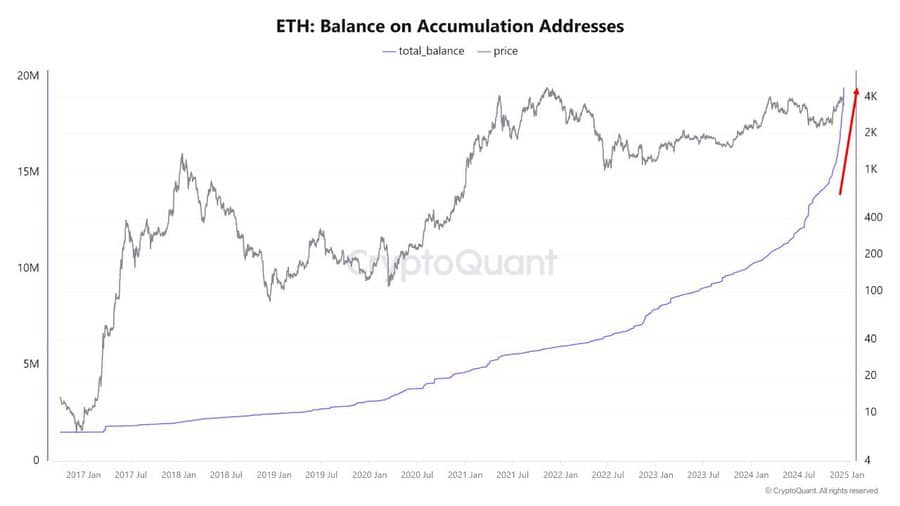
Data from CryptoQuant reveals a surge in the ongoing accumulation of Ethereum (ETH), indicating that more addresses are holding the asset with a long-term perspective.
Currently, the number of addresses holding ETH has increased by 60%. These addresses now account for 16% of the total supply—approximately 19.4 million ETH—up from 10% in August, marking a significant shift in investor behavior.

Source: X
Read Ethereum’s [ETH] Price Prediction 2024-25
Such an accumulation trend is often considered a bullish indicator. It suggests growing confidence among investors and the potential for a substantial price rally.
If this trend continues, ETH could be in position for a significant upward move in the near future.


