
- BTC was down by more than 1.5% in the last seven days.
- Metrics pointed out that BTC could undergo a trend reversal soon.
Bitcoin [BTC] has not offered much on the table of late, as its price has been moving between $43,000 and $42,000 for quite some time.
This price action resulted in the formation of a triangle pattern on the king of crypto’s chart.
From here on, there are two possibilities for BTC’s upcoming price movement. Let’s take a closer look at what they are and which way BTC is most likely to move in the coming days.
Bitcoin to move southwards soon?
According to CoinMarketCap, Bitcoin’s price had dropped by more than 1.4% in the last seven days as it slipped under $43,000.
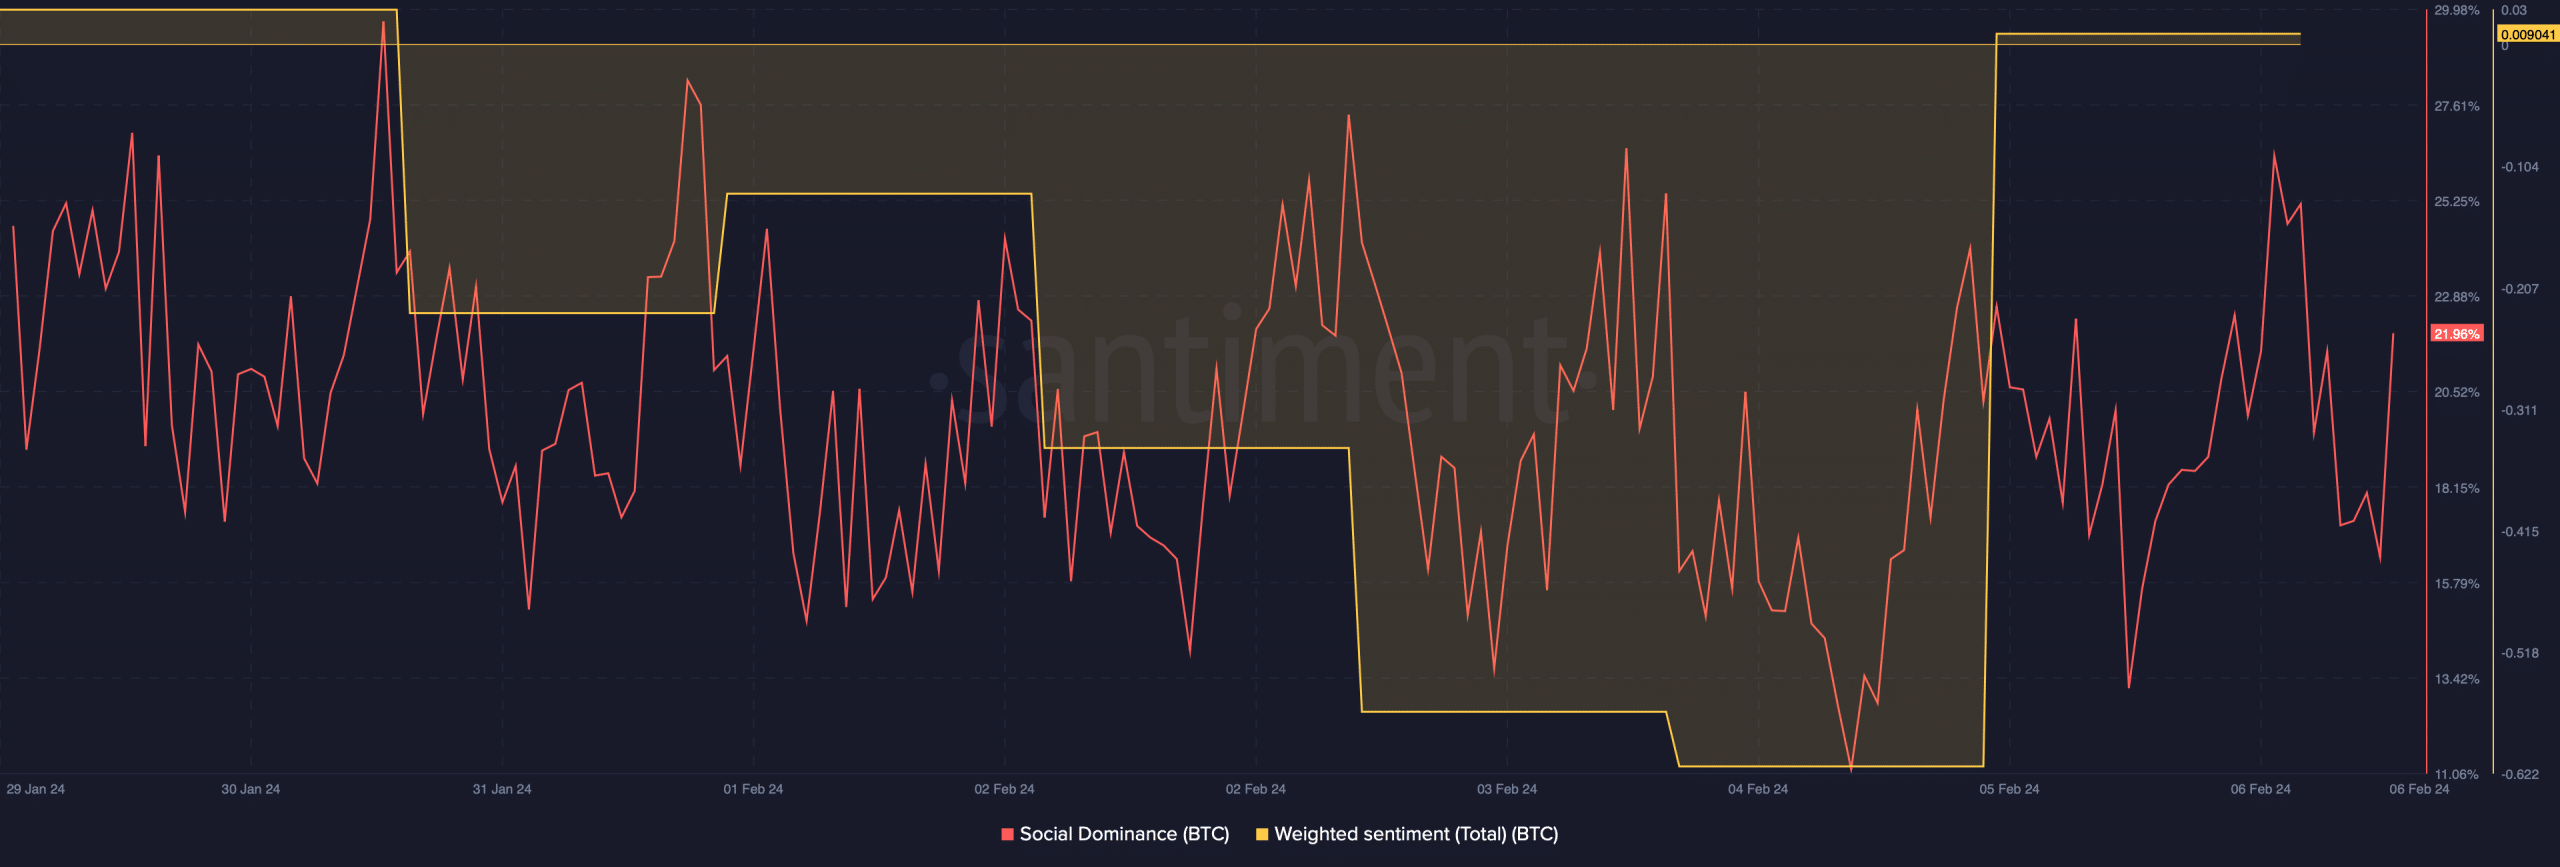
At the time of writing, BTC was trading at $42,708.51 with a market capitalization of over 483.7 billion. This declining price action kept Bitcoin’s Social Dominance high in the last week.
However, bearish sentiment around the coin increased sharply, as evident from the massive dip in its Weighted Sentiment on the 5th of February.

Source: Santiment
Meanwhile, Seth, a popular crypto analyst, recently posted a tweet highlighting an interesting occurrence.
🚨 JUST IN 🚨 #Bitcoin Triangle Pattern Broke out! Most likely scenario is the GREEN Path.
Unless it is a False Breakout! What do you think? Truth or False? $BTC.X $BTChttps://t.co/S46F6fmc7I
Not Financial Advice! pic.twitter.com/hANjhmPRxG
— Seth (@seth_fin) February 5, 2024
As per the tweet, Bitcoin’s price was moving in a triangle pattern. Once BTC approaches the end of the pattern, there can be two outcomes: either a northward breakout or a southward movement.
To understand which of these outcomes is more likely to happen, AMBCrypto took a deeper look at BTC’s state.
Be prepared for another correction!
Miners’ metrics have always been critical when it comes to understanding BTC’s price movements. Miners’ profitability and its relation to BTC’s price are effective ways of assessing market trends.
Axel, an author and analyst at CryptoQuant, recently pointed this out. He used BTC’s hash prices in his analysis and found that during all previous corrections, BTC’s hash price dropped under 0.00006.
Hash Price serves as an indicator of the economic efficiency of mining. It allows to assess how profitable or unprofitable it is to engage in mining at the current moment.
On all previous corrections, the Hash Price dropped to the level < 0.00006 pic.twitter.com/vTpuUr09Yi
— Axel 💎🙌 Adler Jr (@AxelAdlerJr) February 5, 2024
Only after reaching that level does BTC initiate another bull rally. For reference, BTC’s price moved upwards in January, September, and November 2023 after the hash price went below the above-mentioned mark.
At press time, the metric was resting well above that level, indicating that Bitcoin’s price might go down further before its next bull rally.
To see the viability of BTC plummeting further, AMBCrypto checked other metrics.
Our analysis of CryptoQuant’s data revealed that Bitcoin’s aSOPR was in the red at press time, meaning that more investors were selling at a profit. In the middle of a bull market, it can indicate a market top.
Its binary CDD was also in the red, suggesting that long-term holders’ movements in the last seven days were higher than average. Both of these metrics were bearish, hinting at a further price drop.

Source: CryptoQuant
Apart from this, yet another CryptoQuant analysis, posted by G a a H, pointed out that we might be currently witnessing a local market top. This seemed to be the case as BTC’s MVRV ratio reached a two-year high.
MVRV Reaches 2-Year High
“Historically the region we are in signaled a local top before the start of a strong bull market taking BTC prices to a new All Time High” – By @gaah_im
Full post 👇https://t.co/neqFUuqn3e pic.twitter.com/VRRfyEM1nr
— CryptoQuant.com (@cryptoquant_com) February 5, 2024
The analysis mentioned,
“Historically the region we are in signaled a local top before the start of a strong bull market taking BTC prices to a new All Time High.” Therefore, the chances of BTC’s price registering a decline before initiating another bull rally were high.
Anything bullish in the short term?
However, nothing can be said with the utmost certainty, thanks to the unpredictable nature of the crypto space.
G a a h’s analysis also mentioned that the upcoming halving event could turn out to be a strong positive catalyst for the market.
AMBCrypto’s look at Glassnode’s data revealed an interesting update. We found that after spiking, Bitcoin’s Network Value to Transactions (NVT) Ratio registered a drop on the 5th of February 2024.

Source: Glassnode
A drop in the metric typically indicates that an asset is undervalued, which can trigger buying pressure and help increase its price. AMBCrypto found that buying pressure on the coin was increasing at press time.
This was evident from the spike in its Exchange Outflow. Moreover, BTC’s Supply on Exchanges also remained lower than its Supply outside of Exchanges, further proving high buying pressure.

Source: Santiment
Read Bitcoin’s [BTC] Price Prediction 2024–25
To look for other bullish indicators, AMBCrypto took a look at Bitcoin’s daily chart. As per our analysis, BTC’s Relative Strength Index (RSI) went up from the neutral mark.
Its Money Flow Index (MFI) also registered a sharp uptick, increasing the chances of a price uptick in the near term.

Source: TradingView







