
The decentralized Oracle network Chainlink and its native token LINK have grown impressively in the past month. Despite experiencing a correction since late December, where LINK reached a 20-month high of $17.6, the token has shown signs of renewed bullish momentum.
Key Resistance Levels For LINK’s Price Rally
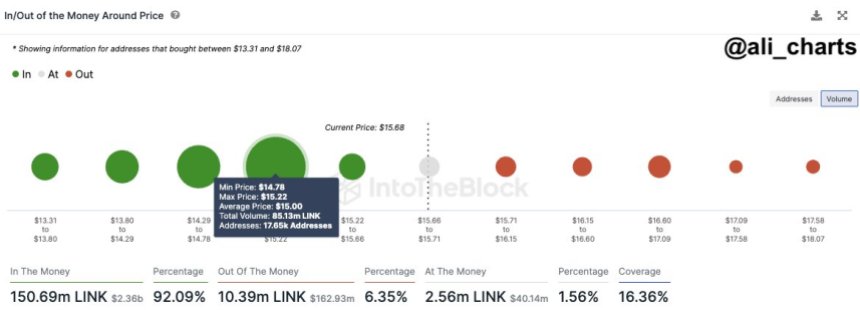
Renowned crypto analyst Ali Martinez has identified a robust demand zone for Chainlink between $14.8 and $15.2, slightly below its current trading price of $15.415.
Within this range, many addresses (17,650) purchased 85.12 million LINK. With limited resistance, LINK appears to be well-positioned to advance towards the $20 mark.
Based on the analyst’s observations, if the current bullish momentum witnessed over the past seven days persists, LINK could swiftly reach the $20 price level. Looking at LINK’s 1-day chart, the next resistance levels to overcome before potentially climbing toward $20 are $15.55, $16.69, and $16.92. Breaching these levels would pave the way for a clear path towards the $20 milestone.
However, it is important to note that in the absence of major resistance walls, the battle for the next direction of LINK’s movements remains equally balanced. In the event of another price correction or selling pressure, the token lacks significant support walls to rely on.
Analyzing LINK’s 1-day chart, the first support level in the event of a drop would be around $14.22. If this level is breached, the next support stands at $13.31. A further decline could test the support at the $11 price level. A breach of this level could signify a breakdown in the four-month bullish structure of LINK.
Chainlink Ecosystem Growth
Despite the battle for supremacy between LINK’s bulls and bears, the protocol’s ecosystem has shown notable growth in key metrics since the last update. For example, Chainlink’s circulating market capitalization is $8.35 billion, reflecting a positive growth rate of 3.58%.
According to Token Terminal data, in terms of revenue over the past 30 days, Chainlink has generated $11.67 thousand. However, this figure shows a decline of 54.16% compared to the previous period, indicating a decrease in earnings during this timeframe.
Considering the fully diluted market capitalization, which considers the maximum number of Chainlink tokens that could exist in the future, the value stands at $14.82 billion. This metric has experienced a slight increase of 3.48% recently.
When it comes to revenue on an annual basis, Chainlink has generated $219.81 thousand. This represents a positive growth rate of 2.64%, indicating an upward trend in the company’s earnings over a year.
Regarding financial ratios, Chainlink’s price-to-fully-diluted ratio is calculated at an astonishing 68,246.47x. This metric compares the company’s market capitalization to its fully diluted market capitalization. It reflects the premium investors will pay for each unit of potential future tokens.
Similarly, based on the fully diluted market capitalization, the price-to-sales ratio is reported to be 68,246.47x. This ratio measures the company’s valuation relative to its annualized revenue and indicates how much investors will pay for each dollar of sales generated.
Featured image from Shutterstock, chart from TradingView.com
Disclaimer: The article is provided for educational purposes only. It does not represent the opinions of NewsBTC on whether to buy, sell or hold any investments and naturally investing carries risks. You are advised to conduct your own research before making any investment decisions. Use information provided on this website entirely at your own risk.







