• Crypto
    • Bitcoin
    • Ethereum
    • Altcoins
    • Cardano
    • Solana
  • Web 3
    • Metaverse
    • NFT
  • Blockchain
  • Analysis
  • Learn
  • AI & VR
  • Gaming
  • Marketcap
  • Shop
What's Hot

Is Staking Crypto Safe? What You Should Know Before Staking

September 15, 2026

What Is the CLARITY Act and What Does It Mean for Crypto?

September 14, 2026

What Is Cross Margin in Crypto? How It Works, Risks, and Examples

September 14, 2026
Facebook Twitter Instagram
  • Contact
  • Disclosure
  • Privacy Policy
  • Terms & conditions
Facebook Twitter Instagram
VIP Crypto Signals
  • Crypto
    • Bitcoin
    • Ethereum
    • Altcoins
    • Cardano
    • Solana
  • Web 3
    • Metaverse
    • NFT
  • Blockchain
  • Analysis
  • Learn
  • AI & VR
  • Gaming
  • Marketcap
  • Shop
VIP Crypto Signals
Home » Blog » Bitcoin at $66K: Why your BTC price predictions have been wrong lately
Bitcoin

Bitcoin at $66K: Why your BTC price predictions have been wrong lately

April 5, 2024No Comments3 Mins Read
Share
Facebook Twitter LinkedIn Pinterest Email
  • BTC’s weighted sentiment has been negative for the past three weeks.
  • Other on-chain indicators hint at the possibility of further price decline below $66,000.

As Bitcoin [BTC] extends its weekly loss by another 4%, its weighted sentiment continues on its bearish trend, according to Santiment’s data. 

In a post on X (formerly Twitter), Santiment noted that BTC’s weighted sentiment has been negative for the past three weeks.

The beginning of this bearish trend, which occurred on 14th March, coincided with the coin’s price falling from its $73,750 all-time high. Exchanging hands at $66,572 at press time, BTC’s price has since fallen by 10%.

😱 The crowd’s sentiment toward #Bitcoin and #crypto markets in general has wavered ever since the big correction 3 weeks ago. Even with the $BTC halving now just 2 weeks away, trader sentiment reflects #FUD and #bearish expectations.

With prices bouncing back to $69K… pic.twitter.com/DYs5RYNR95

— Santiment (@santimentfeed) April 5, 2024

Using historical precedents, Santiment added that BTC’s price often “move  (in) the opposite direction of the crowd’s expectation.” 

During periods when the market reaches euphoric highs and expects a continued rally, BTC’s price retraces. Conversely, when sentiment grows poor and the market expects further downside, BTC’s price has been known to initiate an uptrend.

This pattern has played out even in recent times. 

More decline in the short term?

On 4th April, BTC’s price rallied above the $69,000 price level briefly before retracing to the $66,500 region. With new resistance formed at $69,000, on-chain data suggests the possibility of a further decline in the leading crypto’s value in the short term.

See also  What Bitcoin’s rising demand could mean for you

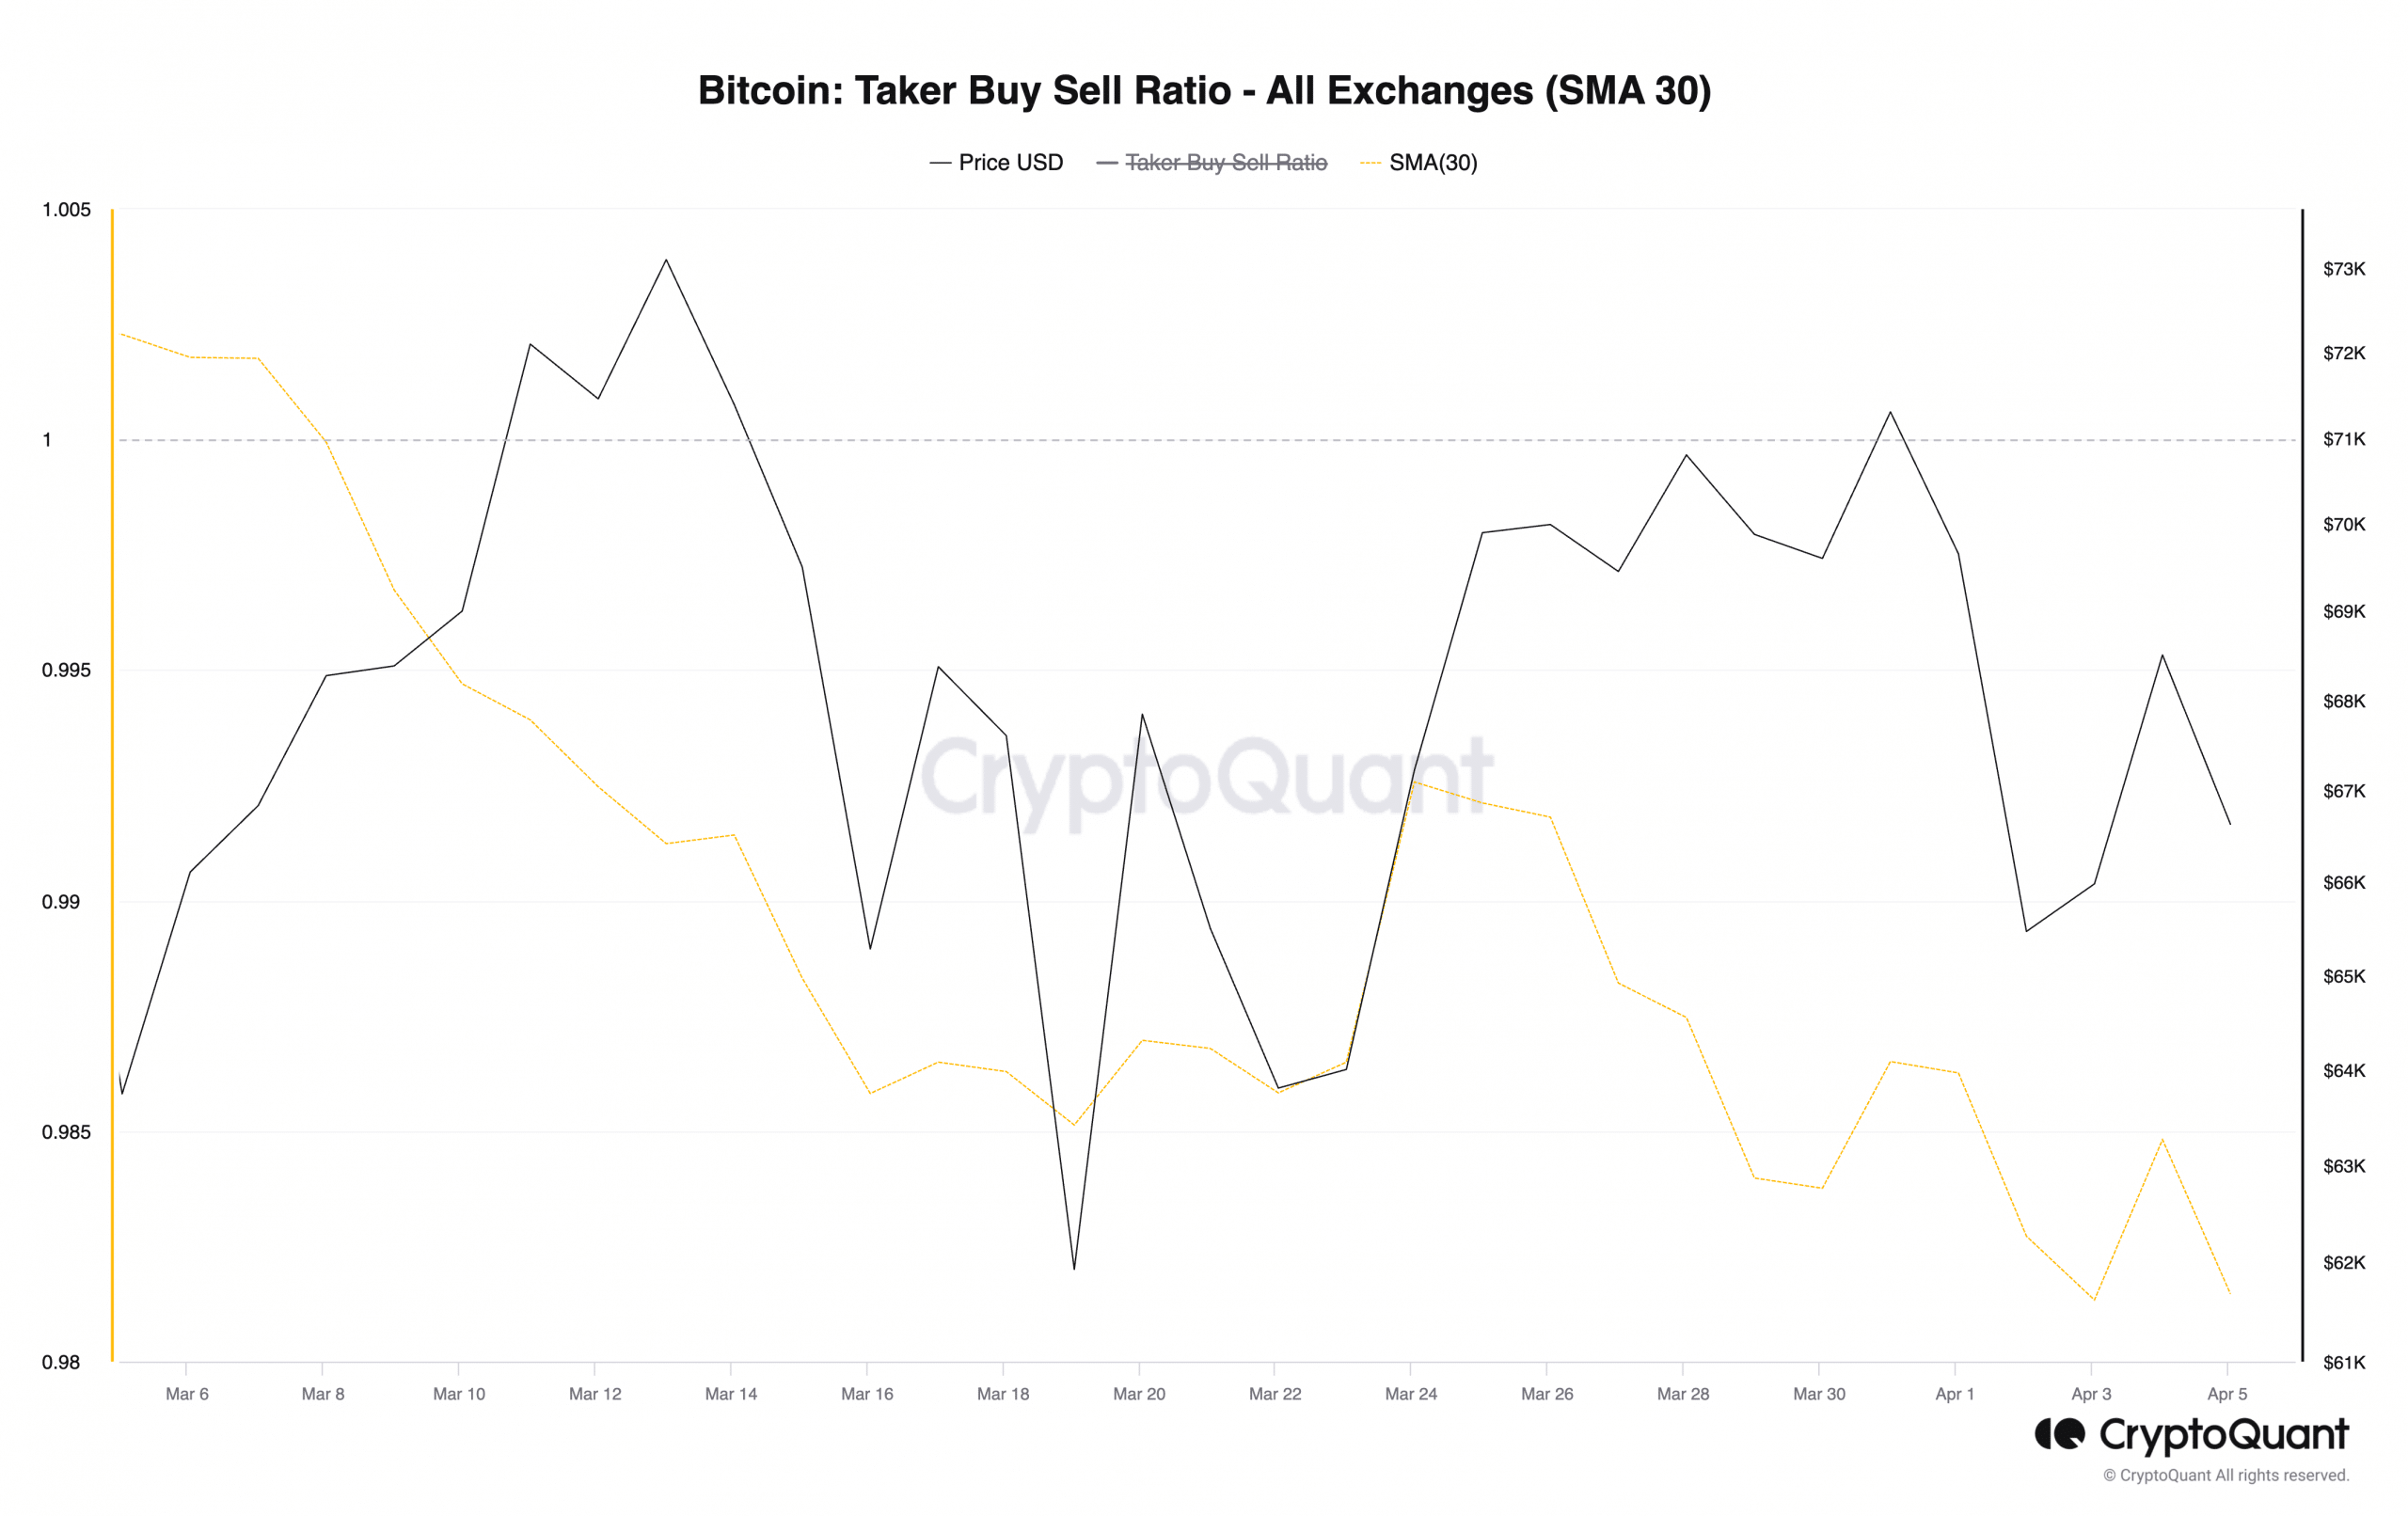
Firstly, the coin’s taker buy-sell ratio assessed on a 30-day simple moving average (SMA) fell below the zero line on 8th March, foreshadowing the price decline that commenced on 14th March.

The taker buy-sell ratio is a metric that measures the ratio between the buy volume and sell volume in an asset’s futures market. A value greater than 1 indicates more buy volume than sell volume, while a value less than 1 indicates more sell volume than buy volume.

Since 8th March, the value of BTC’s taker buy-sell ratio has been less than 1. The steady decline in this metric means that there are more sellers than buyers among those executing immediate trades in the BTC market.

This is expected to continue as long as sentiment remains bearish, putting downward pressure on the coin’s price.
Bitcoin Taker Buy Sell Ratio - All Exchanges (SMA 30)

Source: CryptoQuant

Further, in a recent report, pseudonymous CryptoQuant analyst Tugbachain found that BTC’s NVT Golden Cross closed March flashing a sell signal. 

This indicator compares the 30-day moving average of the coin’s network value to transactions (NVT) ratio with its 10-day moving average.


Read Bitcoin’s [BTC] Price Prediction 2024-25


It generates a long signal when it returns a value less than 1.6. Conversely, when the value is above 2.2, it is taken as a signal to enter short positions. 

According to Tugbachain:

“At the end of March, with the Bitcoin price around $71,000, the NVT value reaching ‘3.17’ levels served as an indicator of reaching a local peak.”

 

Next: Ethereum: Can it beat SEC’s ‘security’ label? JP Morgan says…


Source link

66K Bitcoin BTC predictions Price Wrong
Share. Facebook Twitter Pinterest LinkedIn Tumblr Email

Related Posts

What Is Bitcoin Halving & How Does It Affect BTC Price?

September 1, 2026

Bitcoin Just Hit an All-Time High. Nobody Cares

July 20, 2026

Bitcoin Vegas Belongs to the Suits Now

July 19, 2026

BTC Rainbow Chart Explained: Colors, Bands, and Market Sentiment

July 18, 2026
Add A Comment

Leave A Reply Cancel Reply

Top Posts

Is Staking Crypto Safe? What You Should Know Before Staking

September 15, 2026

What Is the CLARITY Act and What Does It Mean for Crypto?

September 14, 2026

What Is Cross Margin in Crypto? How It Works, Risks, and Examples

September 14, 2026

Subscribe to Updates

Get the latest news and Update from VIP Crypto Signals about Crypto, Web3, Metaverse, NFT and more.

Our mission is to develop a community of people who try to make financially sound decisions. The website strives to educate individuals in making wise choices about Cryptocurrencies, NFT, Metaverse and more.

We're social. Connect with us:

Facebook Twitter Instagram Pinterest YouTube
Top Insights

Is Staking Crypto Safe? What You Should Know Before Staking

September 15, 2026

What Is the CLARITY Act and What Does It Mean for Crypto?

September 14, 2026

What Is Cross Margin in Crypto? How It Works, Risks, and Examples

September 14, 2026
Get Informed

Subscribe to Updates

Get the latest news and Update from VIP Crypto Signals about Crypto, Web3, Metaverse, NFT and more.

Facebook Twitter Instagram Pinterest
  • Contact
  • Disclosure
  • Privacy Policy
  • Terms & conditions
© 2026 Vip Crypto Signals - All rights reserved.

Type above and press Enter to search. Press Esc to cancel.

  • FibSwap DEXFibSwap DEX(FIBO)$0.0084659.90%
  • bitcoinBitcoin(BTC)$70,953.006.13%
  • ethereumEthereum(ETH)$3,664.5818.50%
  • tetherTether(USDT)$1.00-0.01%
  • binancecoinBNB(BNB)$627.698.99%
  • solanaSolana(SOL)$181.131.69%
  • staked-etherLido Staked Ether(STETH)$3,662.5418.48%
  • usd-coinUSDC(USDC)$1.00-0.02%
  • rippleXRP(XRP)$0.545.05%
  • dogecoinDogecoin(DOGE)$0.1634778.14%

