• Crypto
    • Bitcoin
    • Ethereum
    • Altcoins
    • Cardano
    • Solana
  • Web 3
    • Metaverse
    • NFT
  • Blockchain
  • Analysis
  • Learn
  • AI & VR
  • Gaming
  • Marketcap
  • Shop
What's Hot

Is Staking Crypto Safe? What You Should Know Before Staking

September 15, 2026

What Is the CLARITY Act and What Does It Mean for Crypto?

September 14, 2026

What Is Cross Margin in Crypto? How It Works, Risks, and Examples

September 14, 2026
Facebook Twitter Instagram
  • Contact
  • Disclosure
  • Privacy Policy
  • Terms & conditions
Facebook Twitter Instagram
VIP Crypto Signals
  • Crypto
    • Bitcoin
    • Ethereum
    • Altcoins
    • Cardano
    • Solana
  • Web 3
    • Metaverse
    • NFT
  • Blockchain
  • Analysis
  • Learn
  • AI & VR
  • Gaming
  • Marketcap
  • Shop
VIP Crypto Signals
Home » Blog » Bitcoin Poised For Another Surge Like Last Week: Here’s Why
Bitcoin

Bitcoin Poised For Another Surge Like Last Week: Here’s Why

October 30, 2023No Comments3 Mins Read
Share
Facebook Twitter LinkedIn Pinterest Email

In a recent statement via X (formerly Twitter), Alex Thorn, head of firm wide research at digital asset firm Galaxy, highlighted the potential for another Bitcoin gamma squeeze similar to the one witnessed last week. BTC gained 15% last week. He remarked, “The Bitcoin gamma squeeze from last week could happen again. If BTCUSD moves higher to $35,750-36k, options dealers will need to buy $20m in spot BTC for every 1% upside move, which could cause explosiveness if we begin to move up towards those levels.”

Elaborating on the mechanics, Thorn explained the behavior of dealers in relation to gamma and delta. “When dealers are short gamma and price moves up, or when they are long gamma and price moves down, they need to buy spot to stay delta neutral. Last week’s expiries will dampen potential explosiveness, but it’s still in play.” This essentially means that the actions of options dealers, driven by the need to maintain a neutral position, can amplify price movements.

Will Bitcoin Price Rally Like Last Week?

Thorn also emphasized the importance of on-chain data in understanding these dynamics. He mentioned a continued divergence between the supply held by long-term holders and the supply that has moved in less than 24 hours. This divergence, which has been growing over the past year, indicates a decline in on-chain liquidity, suggesting that long-term holders are not selling their holdings, potentially leading to a supply squeeze.

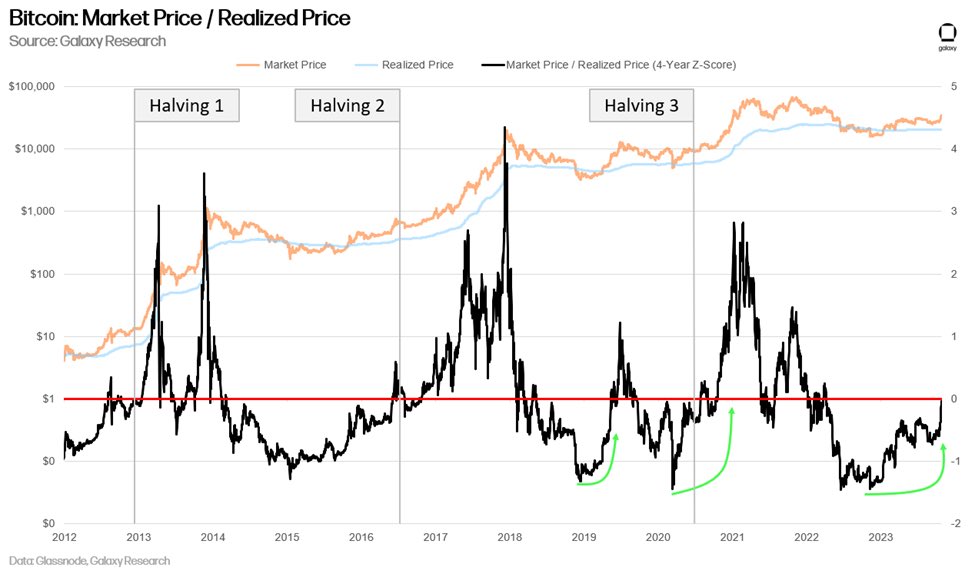
Furthermore, Thorn pointed to the 4-year rolling Z-score of the ratio of market price to realized price, a variation of the MVRV ratio. This metric provides insights into Bitcoin’s valuation relative to its historical average. A high positive Z-score indicates potential overvaluation, while a negative Z-score might suggest undervaluation. Thorn’s observation that the pattern is beginning to resemble those seen before previous bull runs is particularly noteworthy.
See also  Bitcoin Ordinals Driving ‘Renaissance’ in BTC Activity: Franklin Templeton
Bitcoin ratio of market price to realized price
Bitcoin ratio of market price to realized price | Source: X @intangiblecoins

Another crucial observation made by Thorn pertains to the compression of relative cost bases. He noted a tightening pattern that has historically been observed during bear or accumulation periods that precede bull markets. This compression suggests that there is a consensus among different types of holders about the value of Bitcoin.

Thorn’s analysis of the Bitcoin supply by the price at which each coin last moved is particularly illuminating. He observed a sparse cost basis between the current price of $34,591 and the $38,400-39,100 range. Moreover, with 83% of the supply not having moved since prices were lower than today and nearly 70% of the supply stagnant for over a year, it’s evident that long-term holders are in profit and are likely waiting for even higher prices before selling.
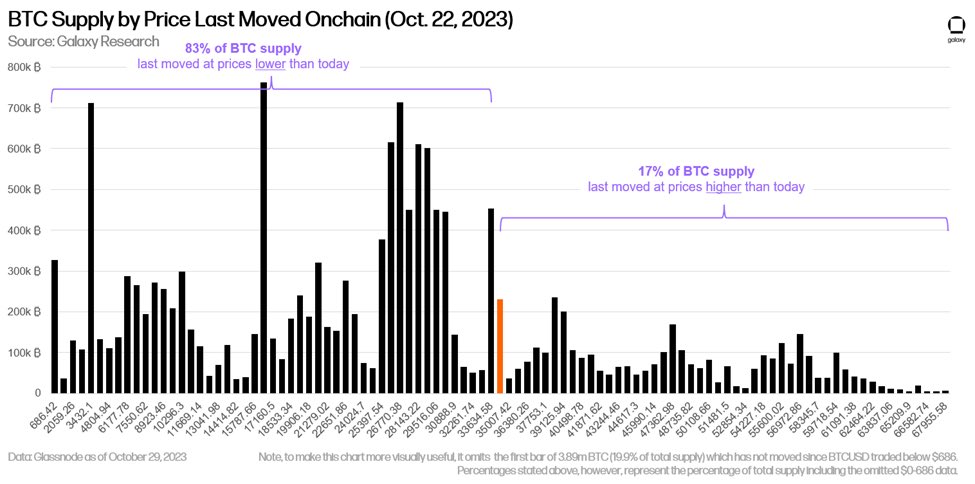
Bitcoin supply by the price ast moved
Bitcoin supply by the price ast moved | Source: X @intangiblecoins

Last week, as reported by NewsBTC, Thorn had accurately predicted a gamma squeeze. He had emphasized the significant role the options market played in influencing Bitcoin’s price trajectory. Thorn warned, “We are approaching max pain for gamma shorts.”

In summary, while Thorn does not make a direct prediction about Bitcoin’s near-term price, his analysis on X provides a comprehensive overview of the current market dynamics. The combination of potential gamma squeezes, declining on-chain liquidity, and historical patterns all point towards a favorable environment for Bitcoin bulls.

At press time, BTC traded at $34,249.
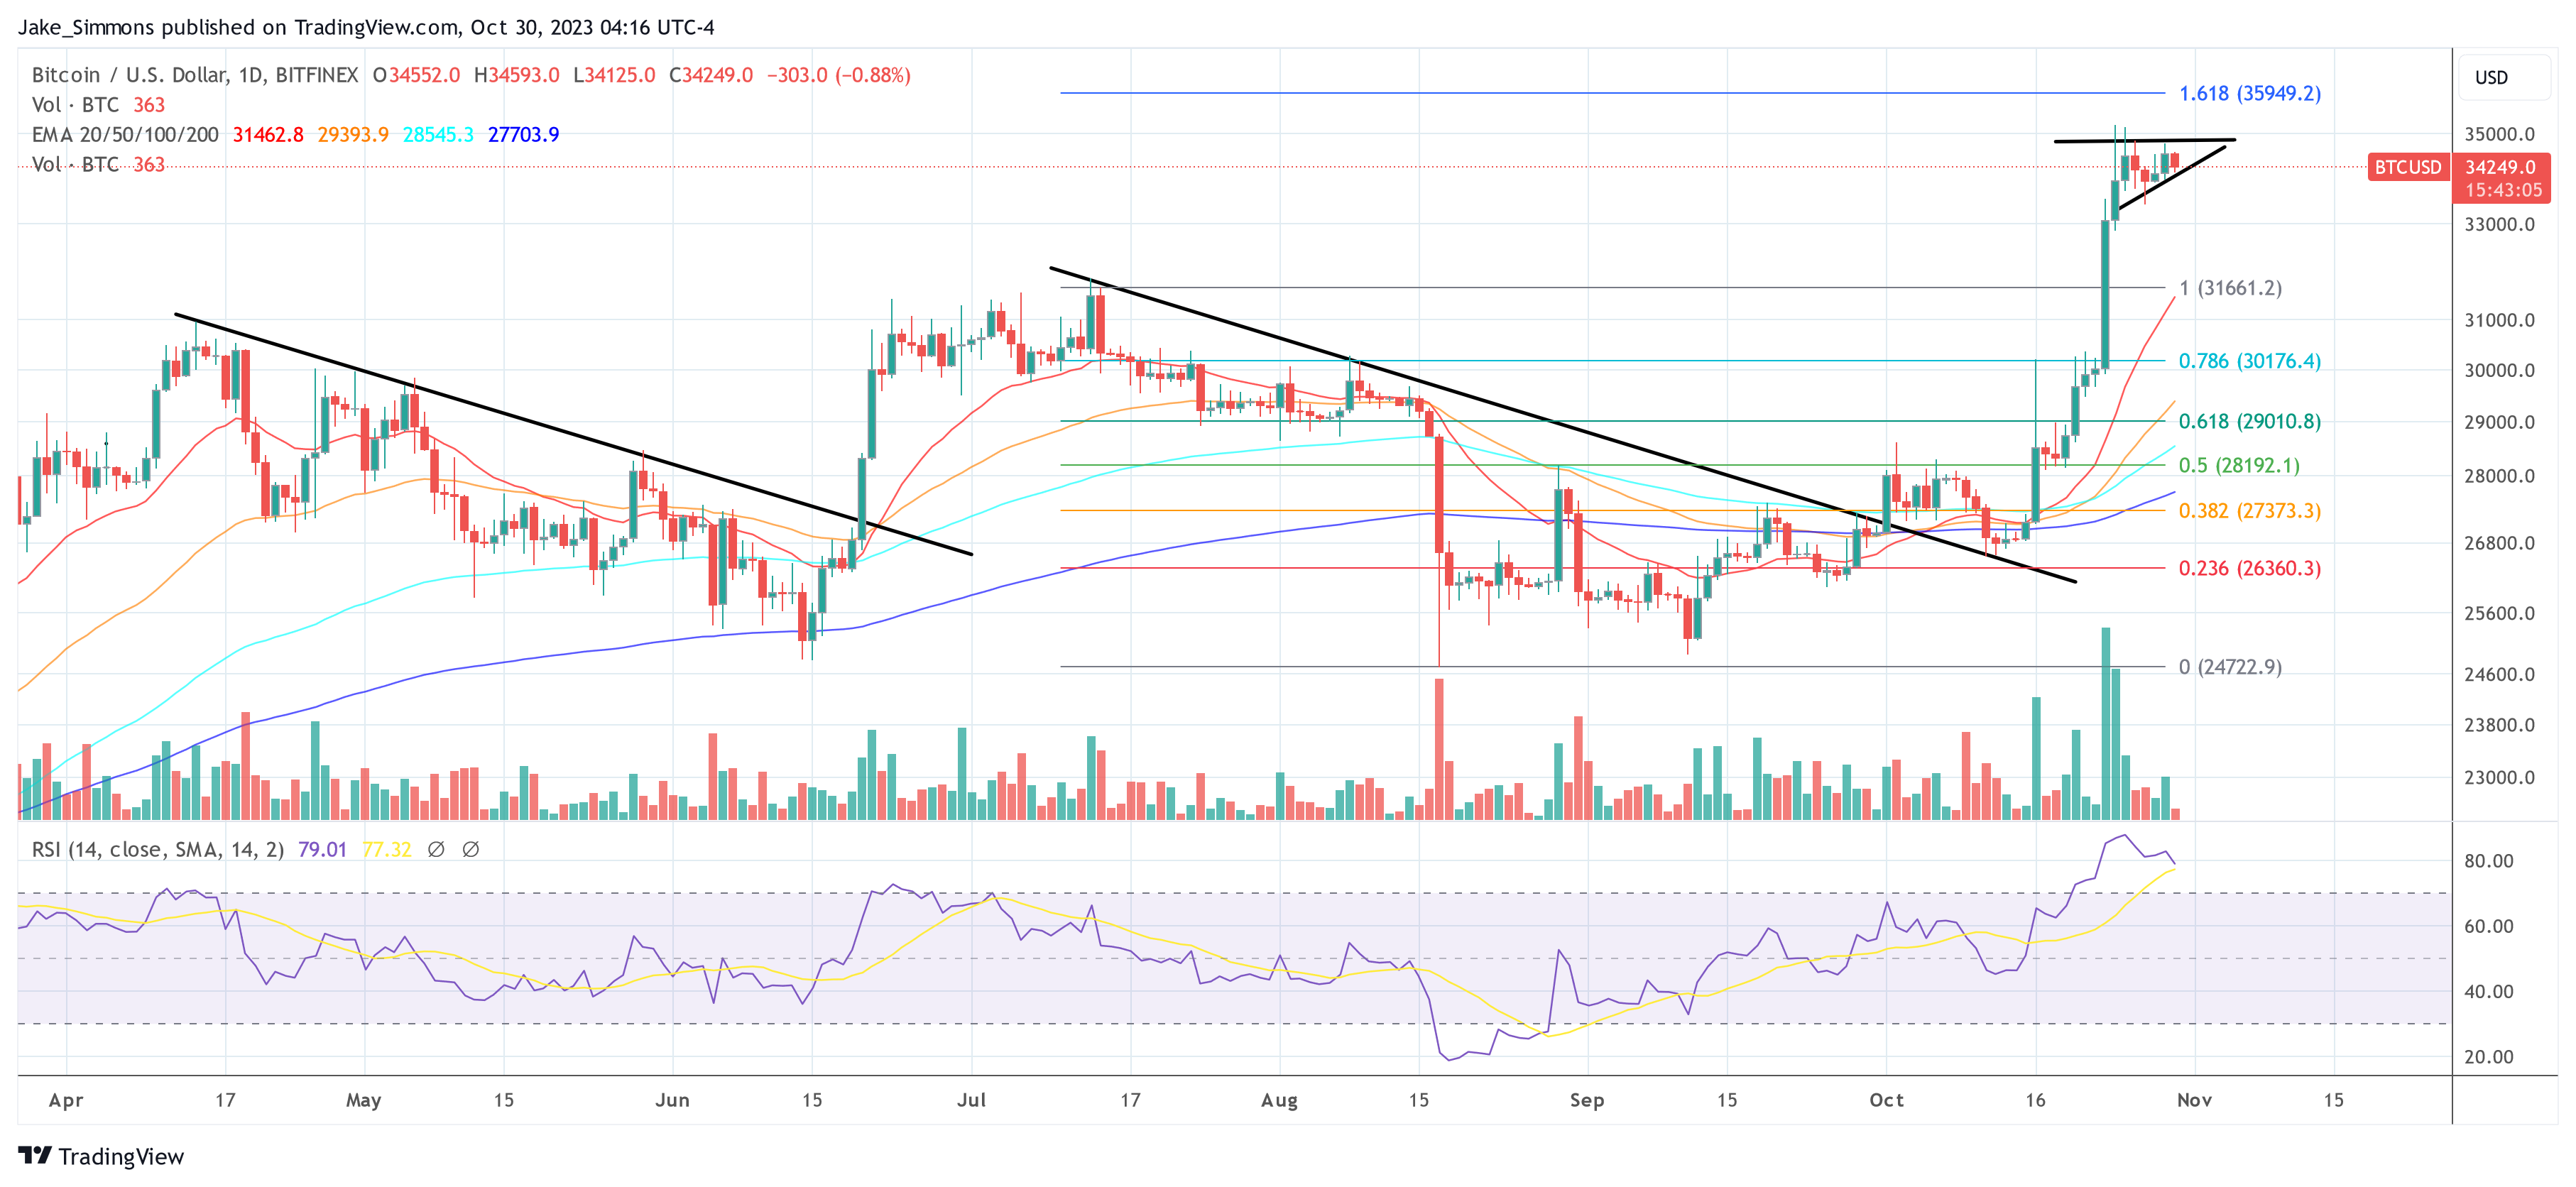
Bitcoin price
Bitcoin price, 1-day chart | Source: BTCUSD on TradingView.com

Featured image from Shutterstock, chart from TradingView.com



Source link

Bitcoin Heres Poised Surge Week
Share. Facebook Twitter Pinterest LinkedIn Tumblr Email

Related Posts

What Is Bitcoin Halving & How Does It Affect BTC Price?

September 1, 2026

Bitcoin Just Hit an All-Time High. Nobody Cares

July 20, 2026

All Eyes on Art: Upcoming Collections to Watch the Week of May 27

July 19, 2026

Bitcoin Vegas Belongs to the Suits Now

July 19, 2026
Add A Comment

Leave A Reply Cancel Reply

Top Posts

Is Staking Crypto Safe? What You Should Know Before Staking

September 15, 2026

What Is the CLARITY Act and What Does It Mean for Crypto?

September 14, 2026

What Is Cross Margin in Crypto? How It Works, Risks, and Examples

September 14, 2026

Subscribe to Updates

Get the latest news and Update from VIP Crypto Signals about Crypto, Web3, Metaverse, NFT and more.

Our mission is to develop a community of people who try to make financially sound decisions. The website strives to educate individuals in making wise choices about Cryptocurrencies, NFT, Metaverse and more.

We're social. Connect with us:

Facebook Twitter Instagram Pinterest YouTube
Top Insights

Is Staking Crypto Safe? What You Should Know Before Staking

September 15, 2026

What Is the CLARITY Act and What Does It Mean for Crypto?

September 14, 2026

What Is Cross Margin in Crypto? How It Works, Risks, and Examples

September 14, 2026
Get Informed

Subscribe to Updates

Get the latest news and Update from VIP Crypto Signals about Crypto, Web3, Metaverse, NFT and more.

Facebook Twitter Instagram Pinterest
  • Contact
  • Disclosure
  • Privacy Policy
  • Terms & conditions
© 2026 Vip Crypto Signals - All rights reserved.

Type above and press Enter to search. Press Esc to cancel.

  • FibSwap DEXFibSwap DEX(FIBO)$0.0084659.90%
  • bitcoinBitcoin(BTC)$70,953.006.13%
  • ethereumEthereum(ETH)$3,664.5818.50%
  • tetherTether(USDT)$1.00-0.01%
  • binancecoinBNB(BNB)$627.698.99%
  • solanaSolana(SOL)$181.131.69%
  • staked-etherLido Staked Ether(STETH)$3,662.5418.48%
  • usd-coinUSDC(USDC)$1.00-0.02%
  • rippleXRP(XRP)$0.545.05%
  • dogecoinDogecoin(DOGE)$0.1634778.14%

