
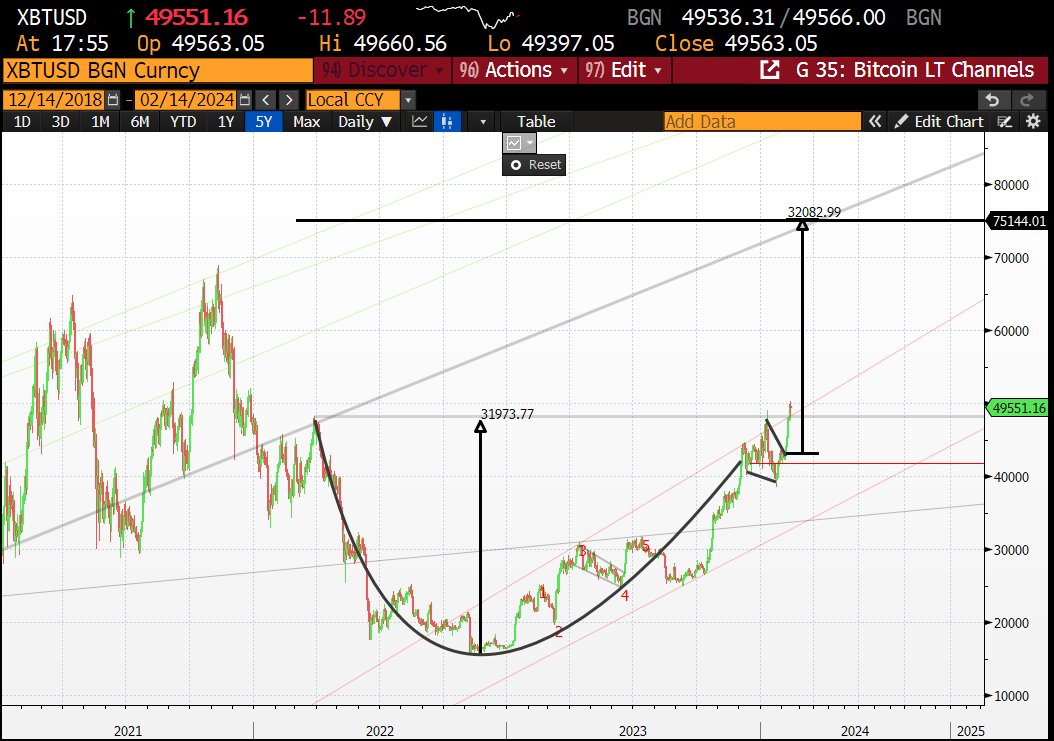
Matt Dines, the Chief Investment Officer at Build Asset Management, has identified a classical ‘Cup and Handle’ pattern in the Bitcoin (BTC) price chart, which he believes could signal an impending rally to $75,000. This technical formation is often considered a strong bullish signal and is closely watched by market analysts and traders.
Bitcoin Price Validates Cup And Handle Pattern
The ‘Cup’ part of the pattern, resembling a bowl or rounding bottom, began forming in March 2022 when the price plunged below $48,000 and entered one of the longest Bitcoin bear markets. The pattern reached its lowest point at approximately $17,600, signifying a strong support level for Bitcoin.
The left side of the pattern shows a rounded bottom resembling a “cup.” It forms when the price initially declines, then consolidates, and finally starts to rise again. Since hitting this bottom, Bitcoin’s price has made a steady recovery, mimicking the right side of the cup, indicating a bullish reversal of the previous downtrend.
“The saucer or the ‘cup’ signifies a consolidation period, a pause in the downward trend, before the price begins to rise back up to the test resistance levels,” Dines explained. The recovery to the initial resistance line completes the ‘cup’ portion of the pattern. The Bitcoin price completed this step in early January this year.
The subsequent ‘Handle’ is represented by a moderate retracement following the recovery, which forms a small dip or pullback from the peak. This handle is identified by a slight downward trajectory and is considered the final consolidation before a breakout.
BTC’s price drop to $38,600 at the end of January marked the bottom of the pullback. With the breakout above $48,000, the Bitcoin price validated the cup and handle pattern.
Setting A BTC Price Target
Dines also addressed the placement of the vertical projection from the bottom of the handle, clarifying its basis: “It’s totally arbitrary and in the eye of the beholder. But longer answer, traders are eyeing charts for formations.”
The vertical target line, or the ‘stick’ on the right, is projected from the bottom of the handle. The height of the cup — from the low at around $17,600 to the resistance line at $48,000— sets the stage for the price target.
Dines added, “A lot of traders will use the height of the bowl (from the low of the bowl to the top at the resistance line) to set their price target. Just add that height to the bottom of the handle … that’s a decent guesstimate for where we’d see the longs who entered on the breakthrough to set their price target.”
Based on the chart, the height from the cup’s low to the resistance level is roughly $31,973, marking the increase in Bitcoin’s price from its lowest point to the current level when the chart was produced. Projecting this height from the handle’s formation suggests a target in the vicinity of $75,000.
Dines further adds that the collective behavior of market participants will indeed guide the price movement: ” A lot of those longs would set a retrace at ~$75k as they close out their W. If enough participants put this trade on it will set the dominant price action … they win out and it will turn the chart into reality. I know it sounds ridiculous, but in the real world this is how markets actually discover price.”
At press time, BTC traded at $51,821.
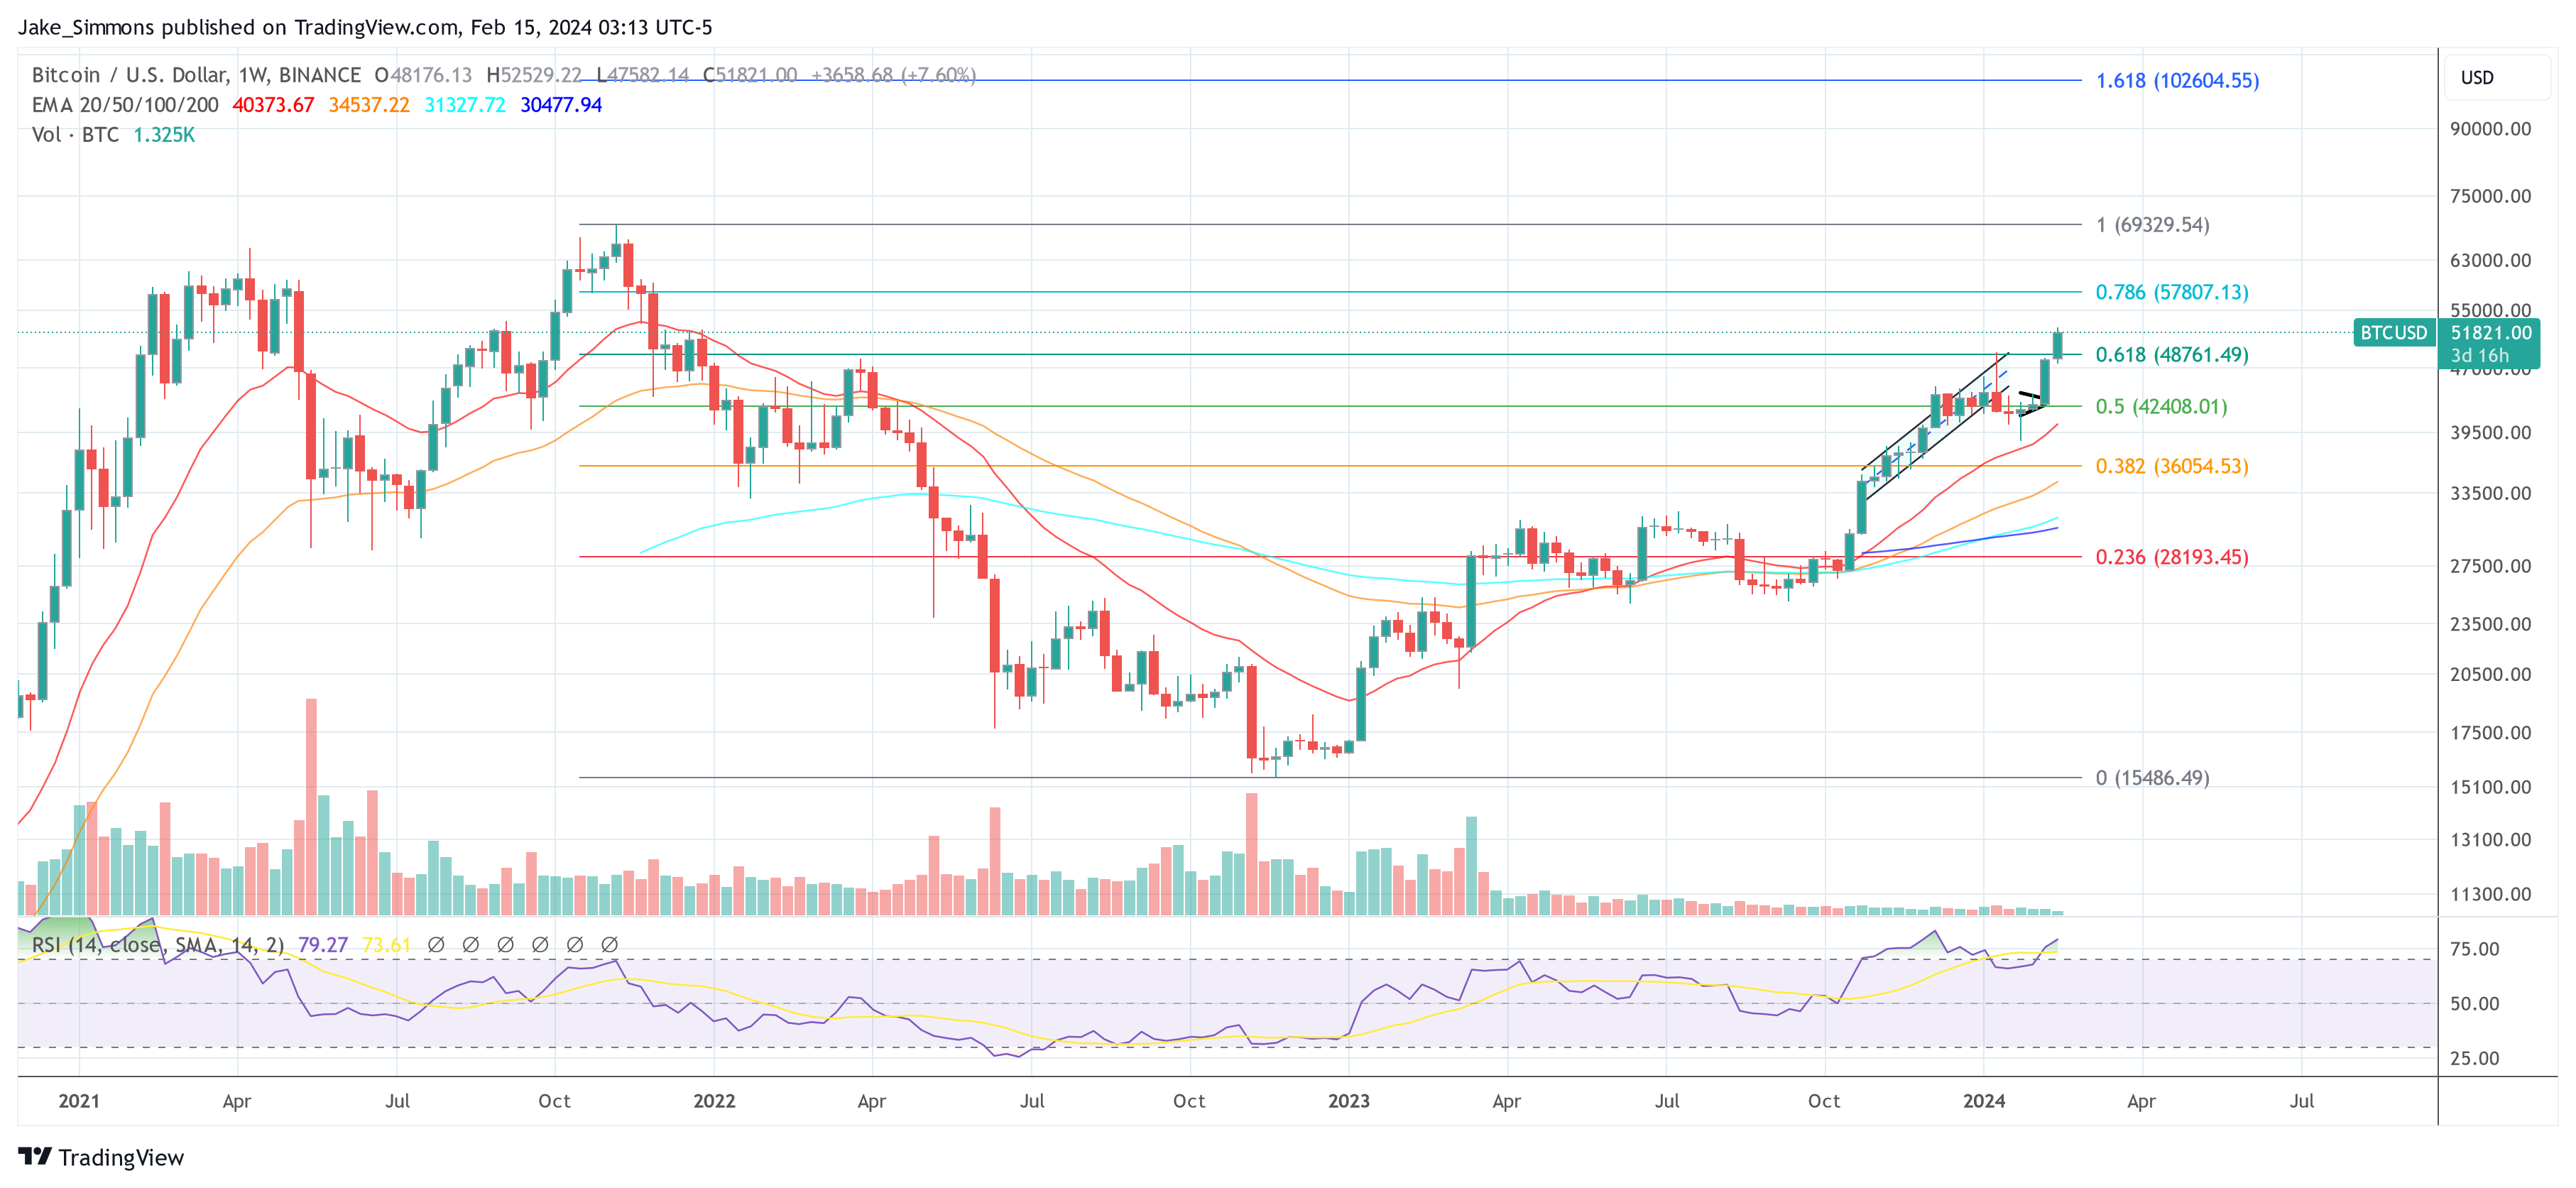
Featured image created with DALLE, chart from TradingView.com
Disclaimer: The article is provided for educational purposes only. It does not represent the opinions of NewsBTC on whether to buy, sell or hold any investments and naturally investing carries risks. You are advised to conduct your own research before making any investment decisions. Use information provided on this website entirely at your own risk.







