
- The average holding time of Bitcoin is around four years, while Cardano’s is less than a year.
- BTC long-term holders have seen more profit than ADA.
Bitcoin’s [BTC] dominance extends beyond its price, as shown by key metrics in the past.
Recent data from IntoTheBlock comparing Bitcoin and Cardano [ADA] further solidified the dominance of the former, despite Cardano’s role as a decentralized platform.
According to the data analyzed by AMBCrypto, Bitcoin boasted a longer average holding time, standing at four years, compared to Cardano’s at 11.4 months.
This difference in holding times suggests that Bitcoin has attracted holders who anticipate a potential future price increase. This is also given the substantial volume these tokens have witnessed over the years.
Comparing Bitcoin and Cardano Sentiment in the last months
An analysis of the funding rates for Bitcoin and Cardano on Coinglass showed notable patterns upon comparison. ADA showed a higher frequency of negative funding rates over the past five months than BTC.
This implies that ADA traders have taken more short positions anticipating a price decline than BTC traders. During this period, BTC’s highest negative funding rate was around -0.017%, whereas ADA experienced around -0.062%.
Furthermore, regarding positive funding rates, ADA’s highest in the same timeframe was around 0.04%, slightly lower than BTC’s 0.05%.
These trends in funding rates show that, for a significant portion of the year, Bitcoin has generally attracted more positive sentiments than Cardano.
Analyzing the Bitcoin and Cardano 3-year MVRV
An examination of the 3-year Market Value to Realized Value ratio (MVRV) for Bitcoin and Cardano sheds light on the preferences of long-term holders favoring BTC.
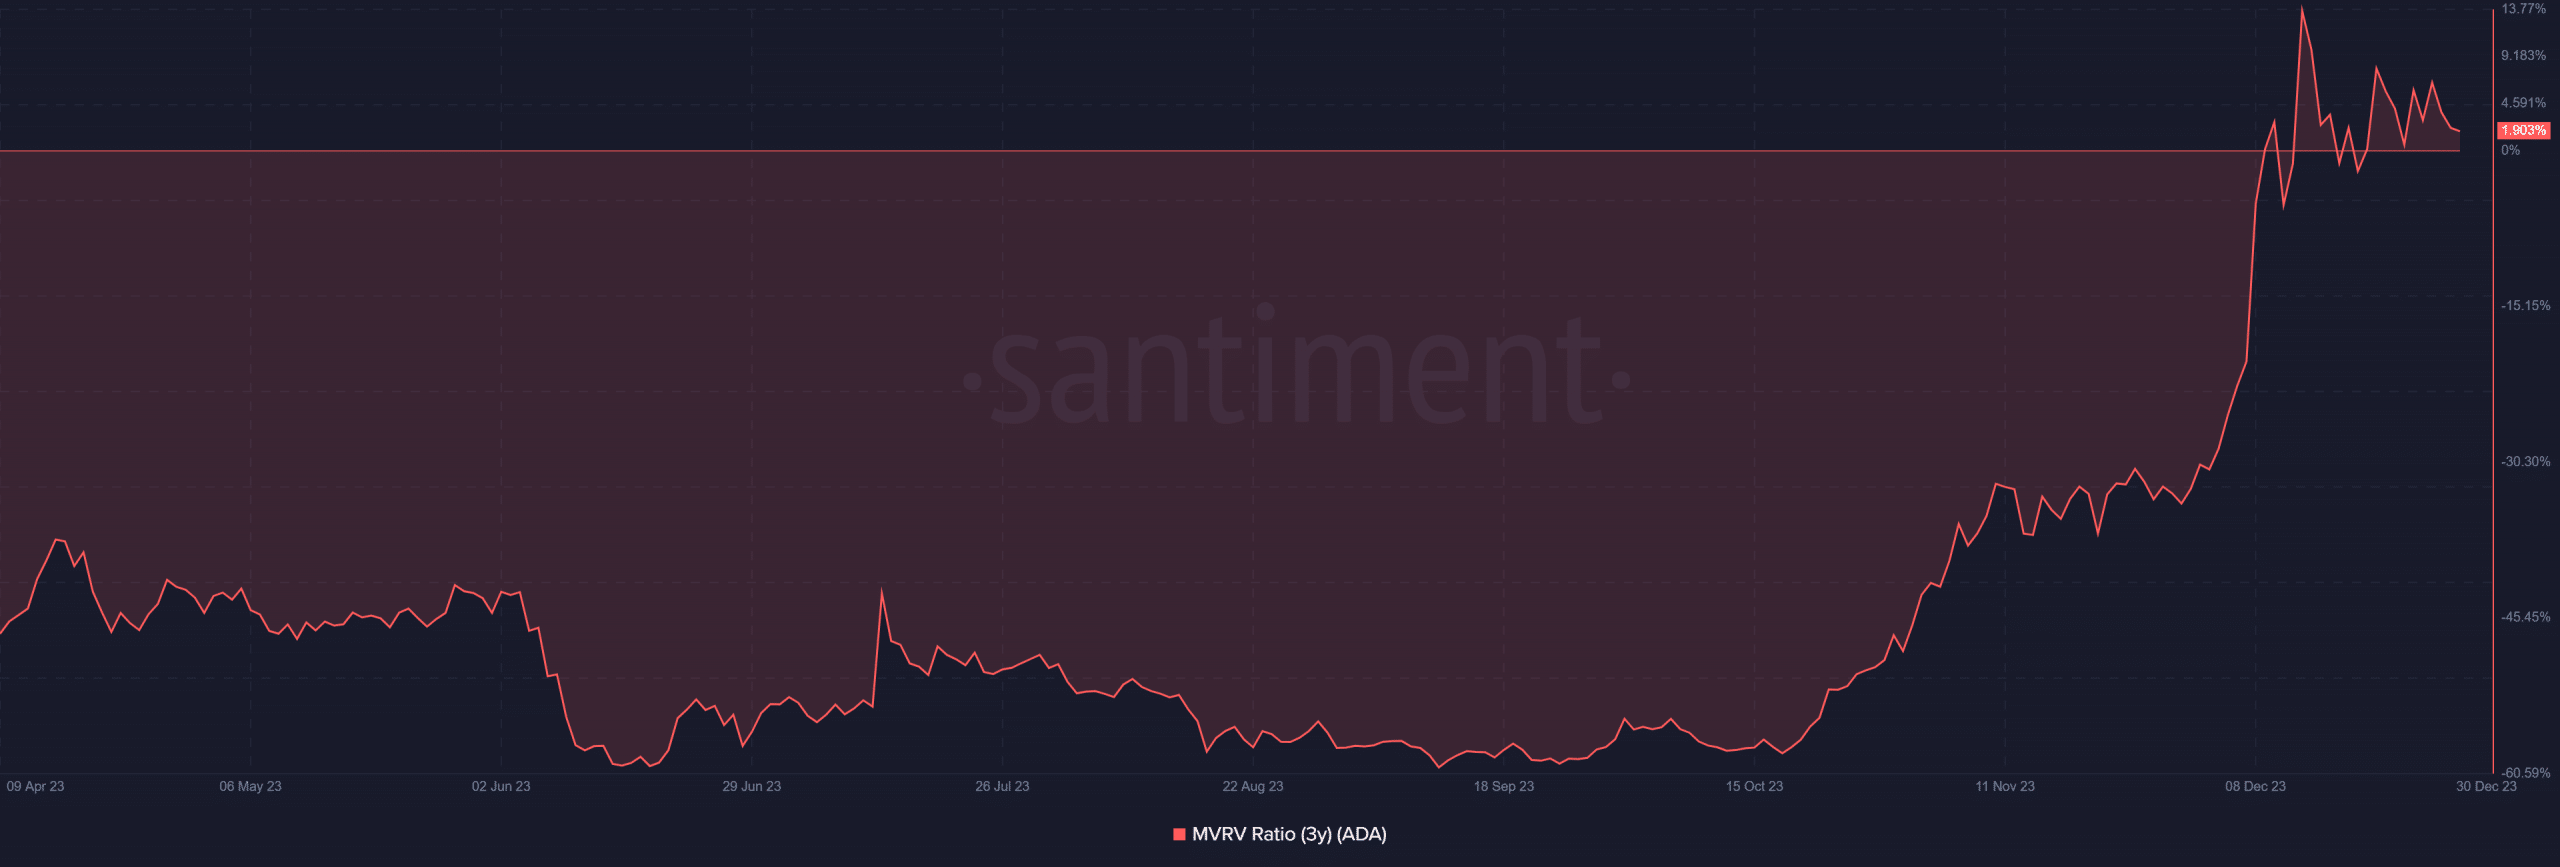
The MVRV analysis for ADA showed a higher frequency of trends below zero compared to BTC. Over the year, ADA’s MVRV was around -50% until recently. However, as of the time of writing, it was around 1.9%.

Source: Santiment
In contrast, BTC’s MVRV ratio went above zero around October, showing more upward trends. As of this writing, BTC’s MVRV was around 20.5%, despite a recent decline.
This positioning showed that holders of BTC over the past three years have been holding a profit of over 20%. On the other hand, ADA holders were holding around 1.9% profit during the same period.
This difference in MVRVs provided insights into why BTC has attracted more long-term holders than ADA.

Source: Santiment
Gauging Bitcoin and Cardano in profit
As per CoinMarketCap’s latest data gauged by AMBCrypto, the press time circulating supply for Bitcoin and Cardano was around 19.5 million and 35.3 billion, respectively.
Examining the profit circulation on Santiment showed that Bitcoin had a higher percentage of its circulating supply in profit compared to Cardano.
At the time of writing, the chart analysis showed that around 16.8 million BTCs were in profit, representing over 85% of the circulating supply.
Conversely, the analysis for ADA showed that around 27 billion was currently in profit, accounting for around 76% of the circulating supply.
Similar to the MVRV analysis, these findings highlight the profitability of holders. Also, it provided insights into why one asset has attracted more long-term holders than the other.
BTC and ADA see slight downtrends
Bitcoin has experienced various price rallies throughout the year, with the most recent surge beginning around October. This corresponds to the period when its 3-year MVRV started an upward trajectory.
Conversely, Cardano’s recent rally started in October, but its MVRV was not impacted until December.
As of the latest update, ADA was trading at around $0.60, with a less than 1% loss. Analyzing the daily timeframe chart shows that this marked the third consecutive day of trading at a loss.
Nevertheless, ADA maintained a bullish trend, as evidenced by its Relative Strength Index (RSI).

Source: Trading View
Read Bitcoin’s [BTC] Price Prediction 2023-24
In contrast, the positive trend of Bitcoin was weakening at the time of writing. BTC’s RSI was around the neutral line, signifying that any decline in price above 1% could push it into a bear trend.
As of the latest update, Bitcoin was trading at around $42,200.

Source: Trading View







