
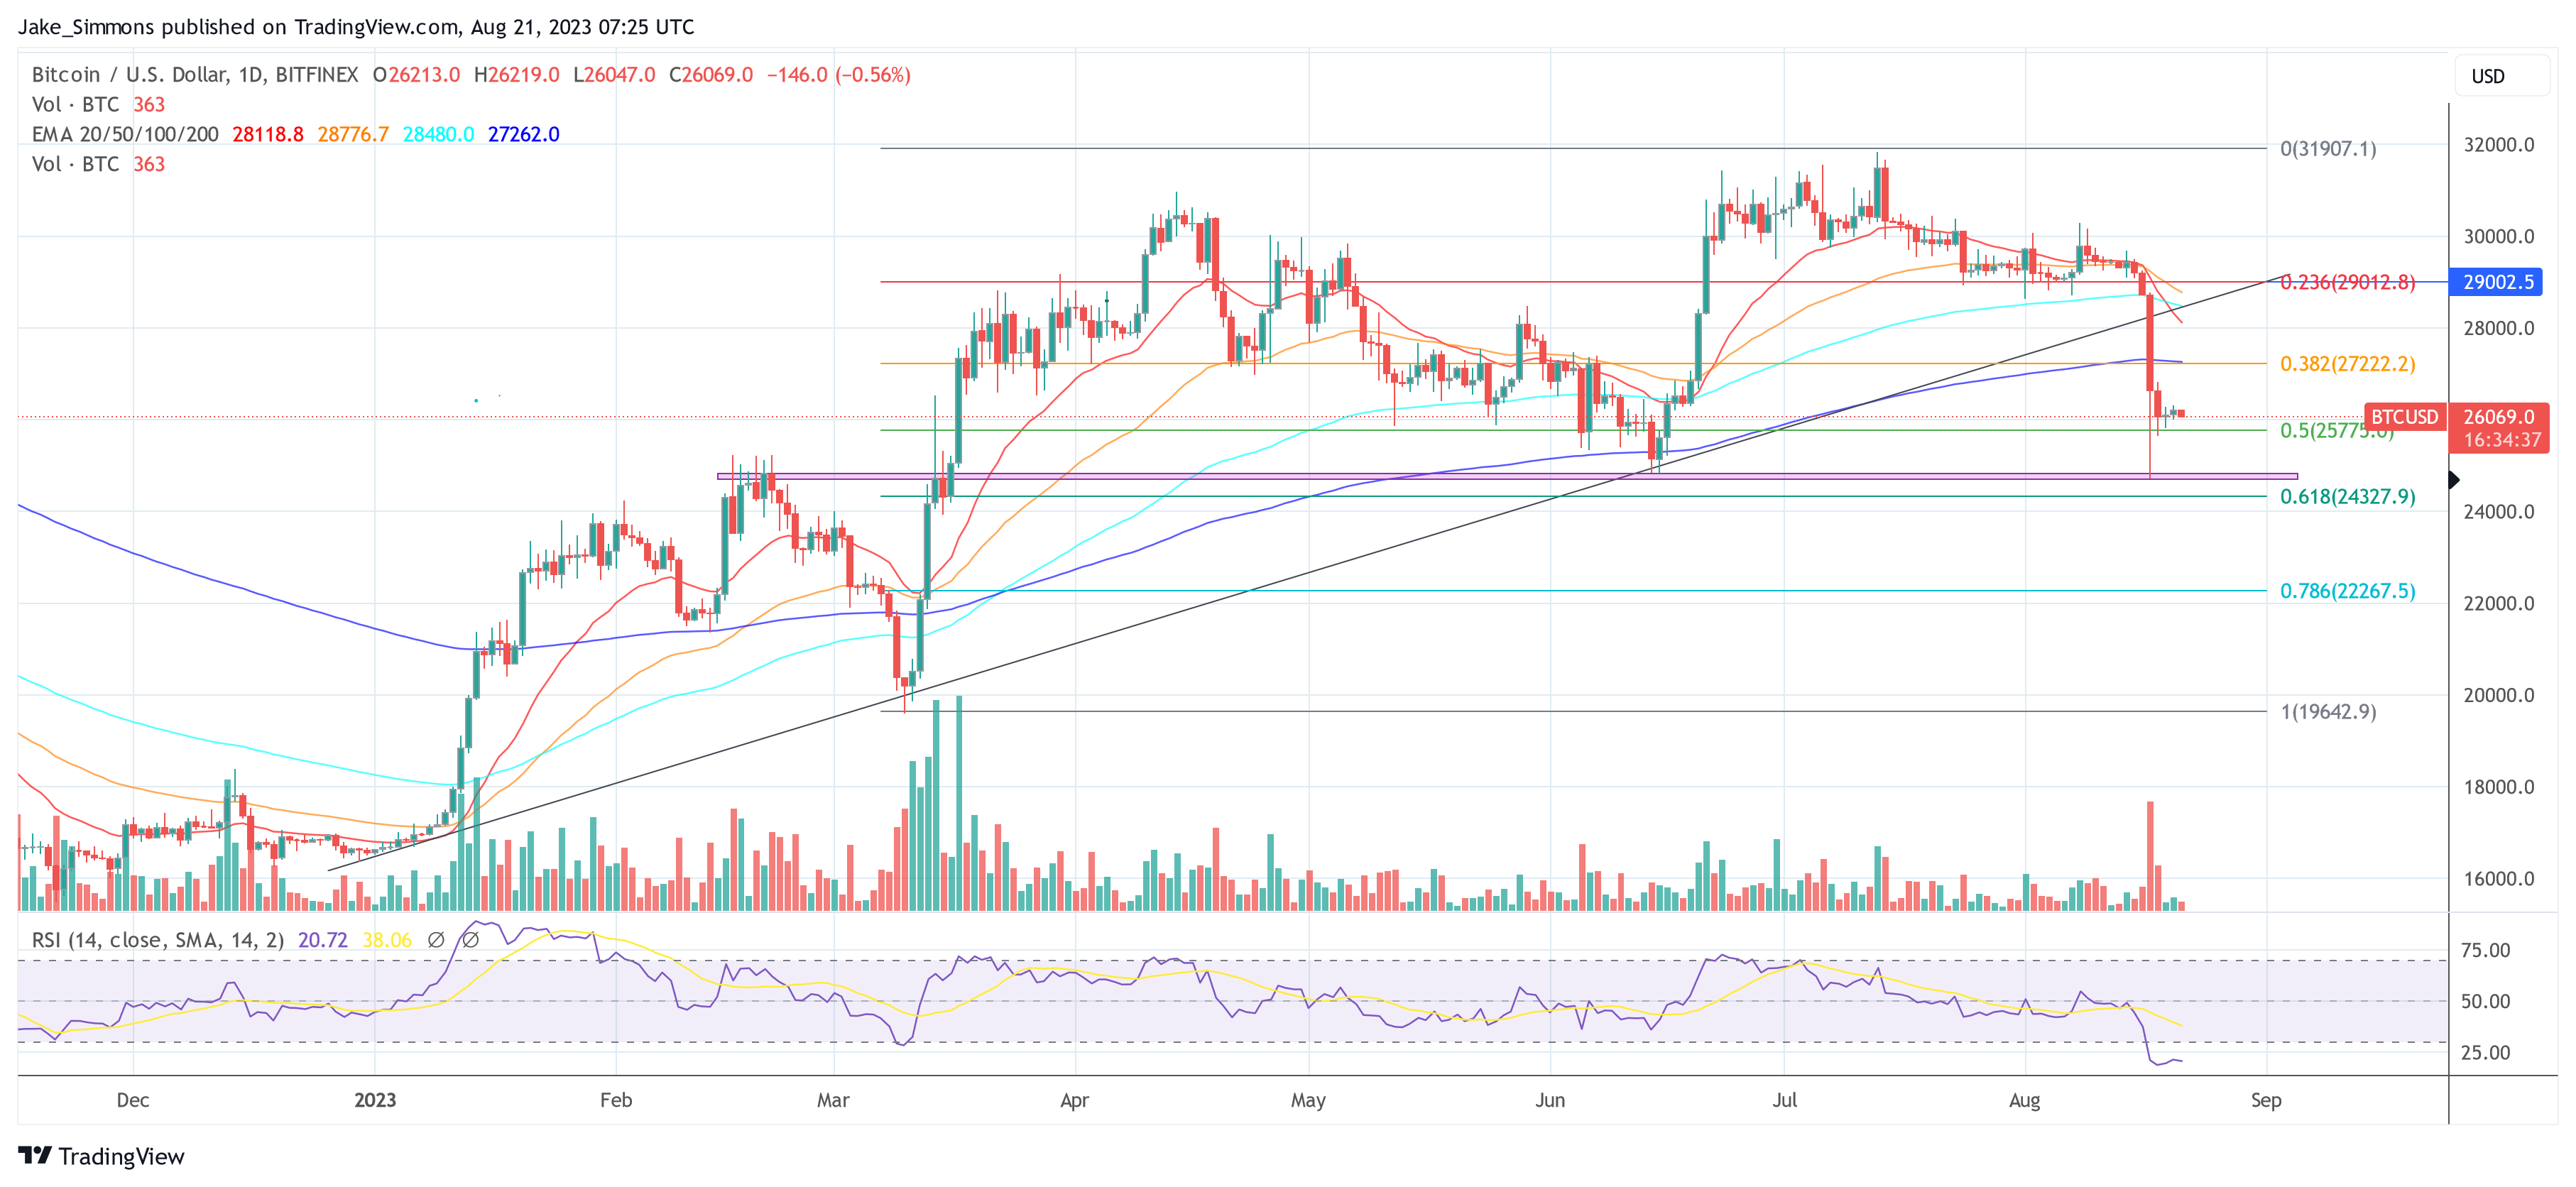
In the wake of the recent crash in Bitcoin’s price, analysts have been rife with speculation about the market’s next steps. The BTC price briefly dipped to a low of $24,800 last week, and with the Bitcoin fear and greed index plunging from neutral to 38 (indicating fear), market sentiment is palpable. Renowned analyst Rekt Capital weighed in on the situation, offering a thorough technical breakdown.
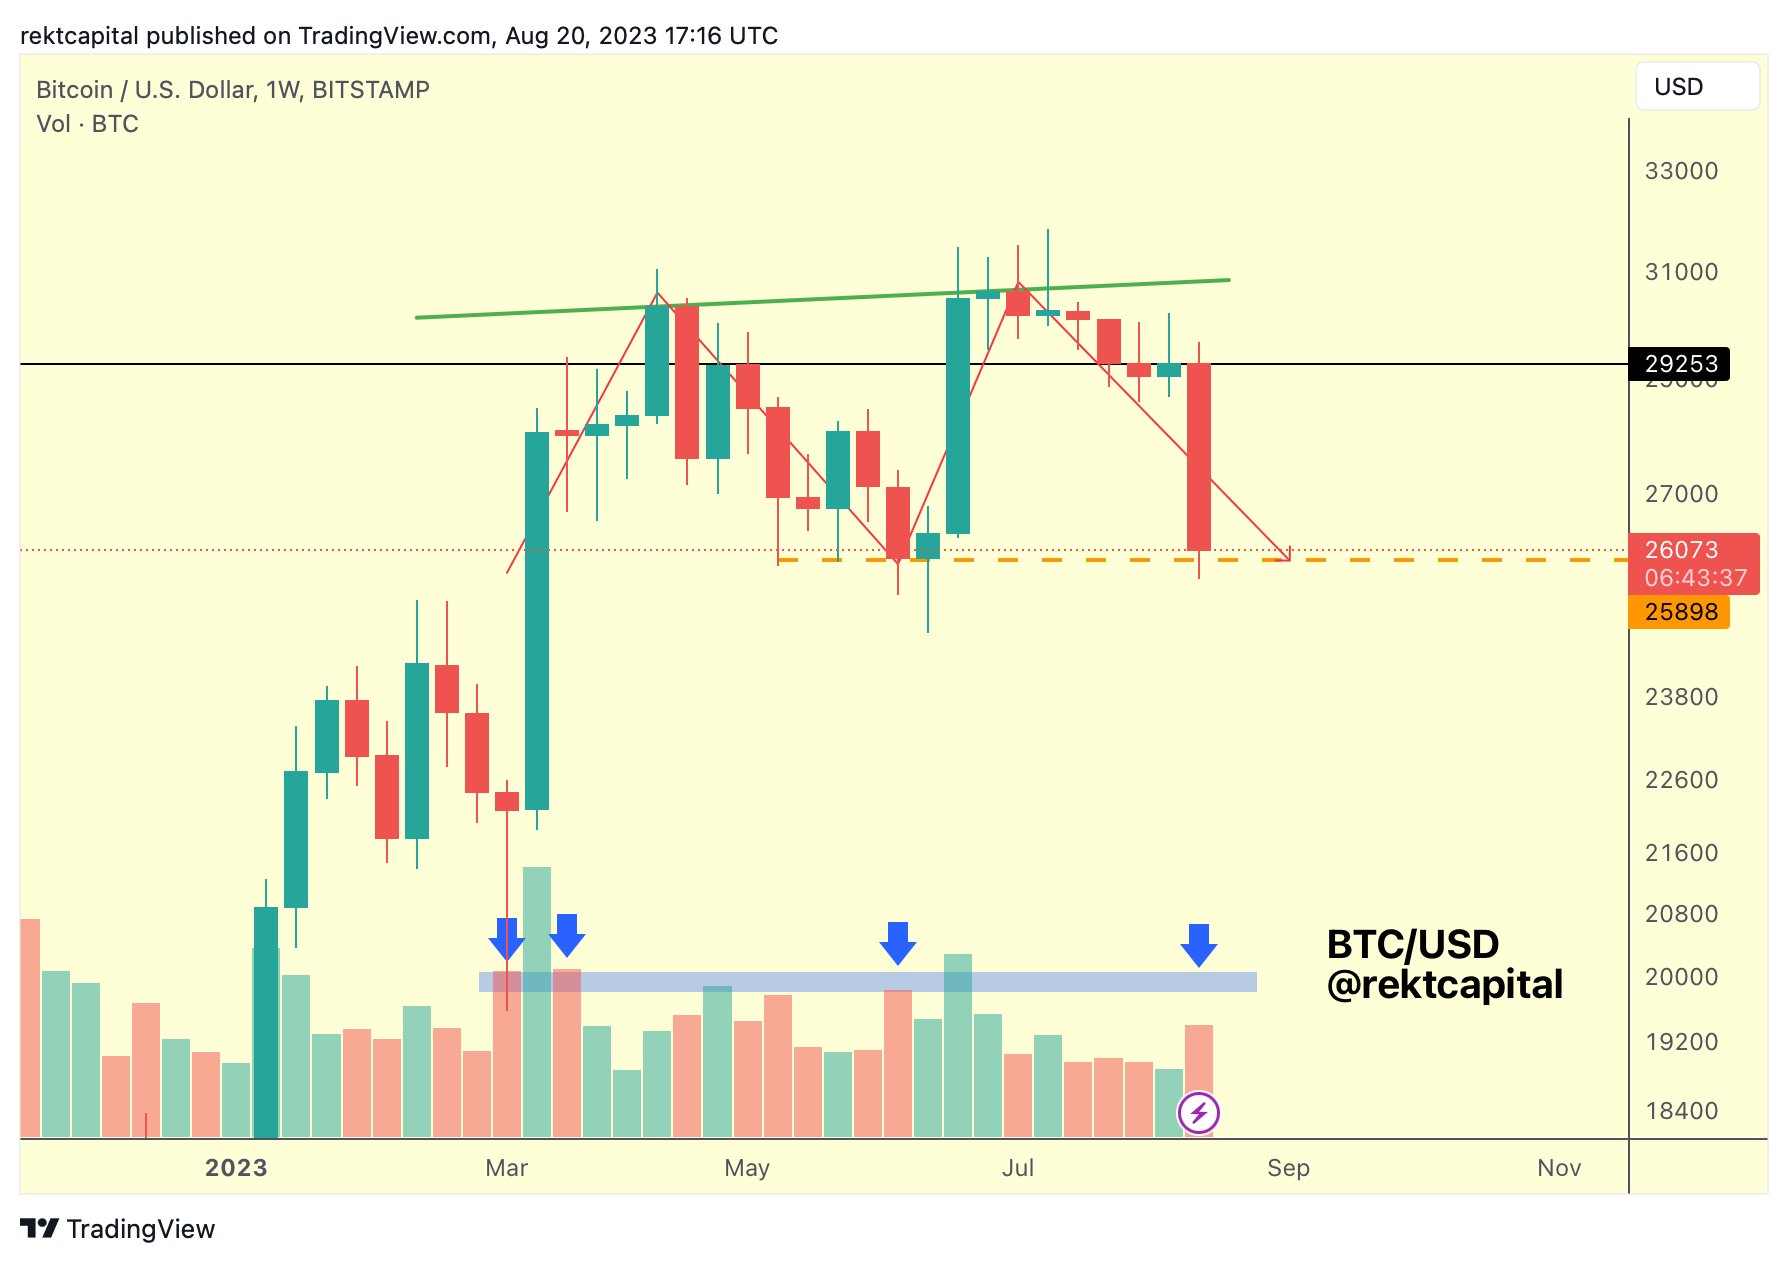
“BTC is officially at the base of the double top. The double top has completed,” states Rekt Capital. Highlighting the market’s current vulnerability, the analyst continues, “Downside wicking below ~$26,000 like in mid-June will occur. But a Weekly Close below ~$260,00 is what would validate the double top and start breakdown continuation.”
Though the double top’s completion has ratcheted up bearish sentiment, there’s no definitive breakdown yet. “BTC has completed the double top but still no breakdown confirmation as BTC holds ~$26k support,” Rekt Capital adds. The scenario becomes even more intriguing as “seller volume has increased in recent days.” The analysis reveals that the “seller volume would need to increase by about +30%” to match the sell-side volume Bitcoin saw during previous price reversals.
Drawing attention to Bitcoin’s volume dynamics, Rekt Capital elucidates, “BTC formed its higher high at ~$31,000 on inclining volume. But price formed the second half of its double top on declining volume.” Even though there was a spike in selling volume during the recent crash, it remains far from the seller exhaustion volume levels seen during previous BTC reversals. As the analyst starkly puts it, the current “seller volume would need to probably double” to mirror the levels that triggered price turnarounds in March and June.
Remarkably, yesterday’s weekly close saw Bitcoin failing to retain support above key bull market moving averages, including the 21-week EMA, 50-week EMA, and 200-week MA. “All of these bullish momentum indicators were confirmed as lost support with the weekly close yesterday,” the analysis points out.
How Low Will Bitcoin Price Drop?
In terms of future projections, Rekt Capital speculates that if the double top’s base at $26,000 is lost, it could propel a move towards $22,000. The analyst elucidates that “if we see a weekly close below $26,000, followed by a rejection from $26,000, then we probably see a confirmed breakdown from this double top.”
However, every bearish note comes with a caveat. Rekt Capital adds, “It’s really easy to get caught up in bearish euphoria… So it’s really important not to get caught in these downside wicks (below $26,000).” And for those seeking potential bullish scenarios, the analyst has one in mind: “Even if we break down from this double top… one of the main areas is this inverse head and shoulders formation that we saw play out earlier this year.” A retest of this pattern’s neckline, roughly around $24,000, could spell bullish prospects for the premier cryptocurrency.
Historical data also lends a hand in making sense of Bitcoin’s trajectory. “A drawdown of 18% to $24,000 would be totally normal for an August month,” the analyst shares, reminding investors that Bitcoin has often underperformed in August. Drawing parallels with 2015, Rekt Capital argues that Bitcoin also approached a halving and lost 18% in August, suggesting that history might repeat, especially with the next halving anticipated in April of the coming year.
At press time, the BTC price was at $26,069.
Featured image from iStock, chart from TradingView.com







