
- BTC could be leaving its formerly formed bear trap.
- A bullish divergence could lay grounds for a short-term rally.
In the last seven days, the value of Bitcoin [BTC] decreased by 7.14% while consolidating around the $26,700 region. However, the days of respite could be near, based on a tweet put out by Gert van Lagen.
Is your portfolio green? Check the Bitcoin Profit Calculator
Steering away from the knees and toes
According to the technical analysis specialist, BTC had formed a “perfect” head and shoulder bottom below the 200-day Simple Moving Average (MA). This caused a bear trap bottom in preparation for a bullish crossover.
$BTC [1W] – Perfect Head-and-Shoulders bottom formed below the weekly SMA200.
Successful double bullish retest of the neckline/SMA200
Perfect #beartrap/bottom W4 before #blowoff top/W5.#Bitcoin #BTC #BullMarket pic.twitter.com/ojzMqMcR8v
— Gert van Lagen (@GertvanLagen) May 26, 2023
Used by traders to identify price reversals, a bearish head and shoulder has three peaks, with the middle one rising higher than the others. In an instance like this, BTC could reverse an upward trend.
But according to Lagen’s chart, the pattern depicted a bearish-to-bullish trend. This was because the middle peak dropped incredibly lower than the sides. This signaled a possible end to the downward trend.
Before his latest observation, the analyst had pointed out a historical impulse, correction, and blowoff trend. There, he noted that it was BTC’s current situation.
On 20 May, he told his 71,900 followers that Bitcoin could be in line for a large degree of bullish movement, as described by the Elliotwave impulse.
$BTC [1W] – Elliottwave impulse 2019-2023
Wave 1 – Impulse
Wave 2 – Correction, Sharp Zigzag
Wave 3 – Impulse , momentum
Wave 4 – Correction, Expanded Flat
Wave 5 – Impulse, Blow-offTarget Wave 5: 170-200k#Bitcoin #BullMarket pic.twitter.com/gegAi0GIvF
— Gert van Lagen (@GertvanLagen) May 20, 2023
Attempts are already on the way
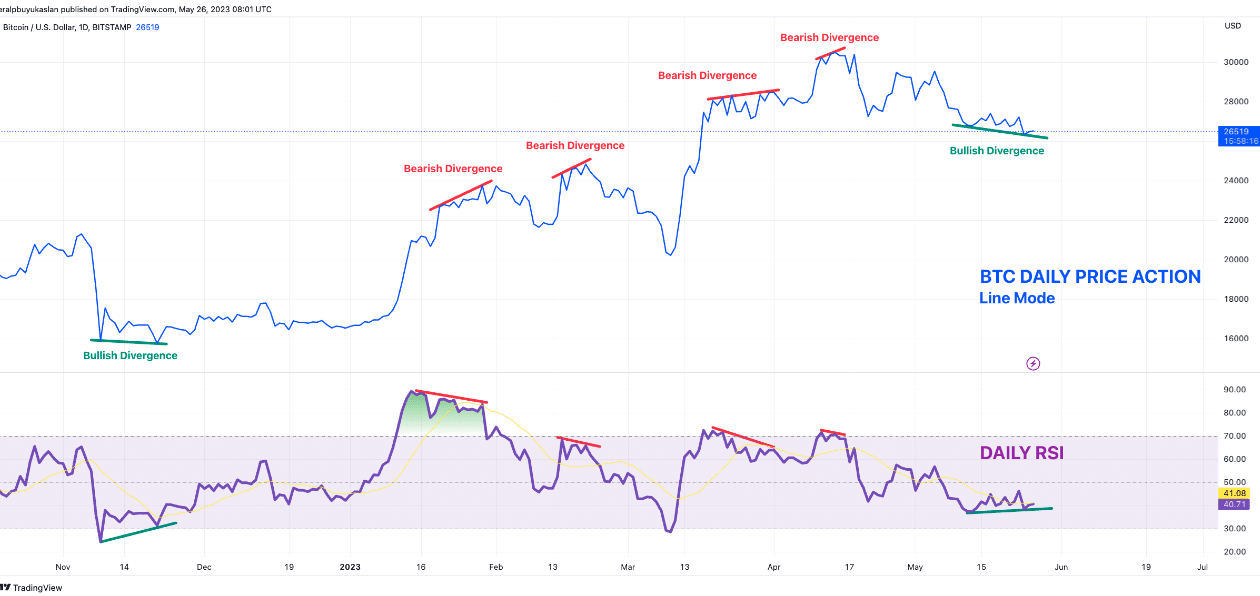
Interestingly, Lagen was not the only part who shared a bullish sentiment. In a 26 May publication on CryptoQuant, Eralp Büyükaslan, BTC was forming a bullish divergence similar to the bearish top exit of November 2022.

Source: CryptoQuant
The crypto investor and analyst also pointed out the negative exchange netflow as another reason for a short-term bullish move. When there is a negative value of the indicator, it means that outflows are overwhelming inflows.
Thus, a possible outcome, when prolonged, could be a sign of accumulation. This, in turn, could become bullish for the price of the asset.

Source: CryptoQuant
From a technical point of view, Bitcoin’s volatility seems to be contracting. Recently, particularly on 25 May, the price left the zone where it touched the lower part of the Bollinger Bands (BB).
How much are 1,10,100 BTCs worth today?
This move means that BTC had exited the oversold zone, even as the price was not near the upper band. At press time, the Relative Strength Index (RSI) was 43.02 — an increase from 38.36 on 24 May.
Though the slight uptick represents a move from the bearish momentum, BTC buyers might need to neutralize the dominance of sellers to solidify the potential bullish trend.
![Bitcoin [BTC] price action](https://statics.ambcrypto.com/wp-content/uploads/2023/05/BTCUSD_2023-05-27_13-13-26.png)
Source: TradingView







