
Introduction
This report provides a technical analysis of Cardano (ADA) for 6 July 2023. The analysis includes an overview of the price and volume and a detailed examination of the daily and monthly technical indicators and moving averages.
This report aims to provide traders and investors with insights into ADA’s short-term and long-term market trends. This can help them decide whether to buy, sell, or hold this cryptocurrency.
Please note that technical analysis does not guarantee future performance and should be used in conjunction with other research and investment strategies.
Price/Volume Overview
As of 5:31 p.m. UTC on 6 July 2023, on Binance, the price of Cardano (ADA) is $0.2821, a decrease of $0.0024 (-0.84%) from the previous close. The volume of ADA traded in the last 24 hours is 127,452,840 ADA. The day’s range is $0.2761 – $0.2937.
Timeframes
In technical analysis, the choice of timeframe plays a significant role. The timeframe refers to the period that the analysis considers. In this report, we use two timeframes: daily and monthly.
- Daily: The daily timeframe uses the price data of each day. Each point on a chart represents the price data of a single day. This timeframe is shorter and thus more suited for traders who aim to profit from short-term price fluctuations in the market.
- Monthly: The monthly timeframe uses the price data of each month. Each point on a chart represents the price data of a single month. This timeframe is longer and thus more suited for investors who aim to profit from long-term price trends in the market.
Technical Indicators
Technical indicators are mathematical calculations based on a cryptocurrency’s price and volume. They help to predict future price levels and market direction, and can generate buy and sell signals. The daily technical indicators provide insights into the short-term market trends, while the monthly technical indicators give a broader view of the long-term market trends.
Here are the definitions of the technical indicators used in this report:
- RSI (14): The Relative Strength Index measures the speed and change of price movements on a scale of 0 to 100. Traditionally, the market is considered overbought when above 70 and oversold when below 30.
- STOCH (9,6): The Stochastic Oscillator compares a cryptocurrency’s closing price to its price range over a certain period of time. The market is considered overbought when above 80 and oversold when below 20.
- STOCHRSI (14): The Stochastic RSI is a combination of the Stochastic Oscillator and the Relative Strength Index. It’s considered overbought when above 80 and oversold when below 20.
- MACD (12,26): The Moving Average Convergence Divergence is a trend-following momentum indicator that shows the relationship between two moving averages of a cryptocurrency’s price.
- ADX (14): The Average Directional Index measures the strength of a trend. A value above 25 indicates a strong trend.
- Williams %R: This momentum indicator measures overbought and oversold levels. Similar to the Stochastic Oscillator, the market is considered overbought when above -20 and oversold when below -80.
- CCI (14): The Commodity Channel Index is a momentum oscillator used to identify cyclical trends in a cryptocurrency. A value above +100 suggests an overbought condition, while a value below -100 suggests an oversold condition.
- ATR (14): The Average True Range measures market volatility.
- Highs/Lows (14): This indicator measures the highest and lowest prices over a specified period.
- Ultimate Oscillator: This oscillator combines short-term, intermediate-term, and long-term price action into one oscillator and uses a weighted average to provide a more accurate picture.
- ROC: The Rate of Change is a momentum oscillator that measures the percentage change in price between the current price and the price a certain number of periods ago.
- Bull/Bear Power (13): These indicators measure the power of buyers (bulls) and sellers (bears) over a certain period.
Daily
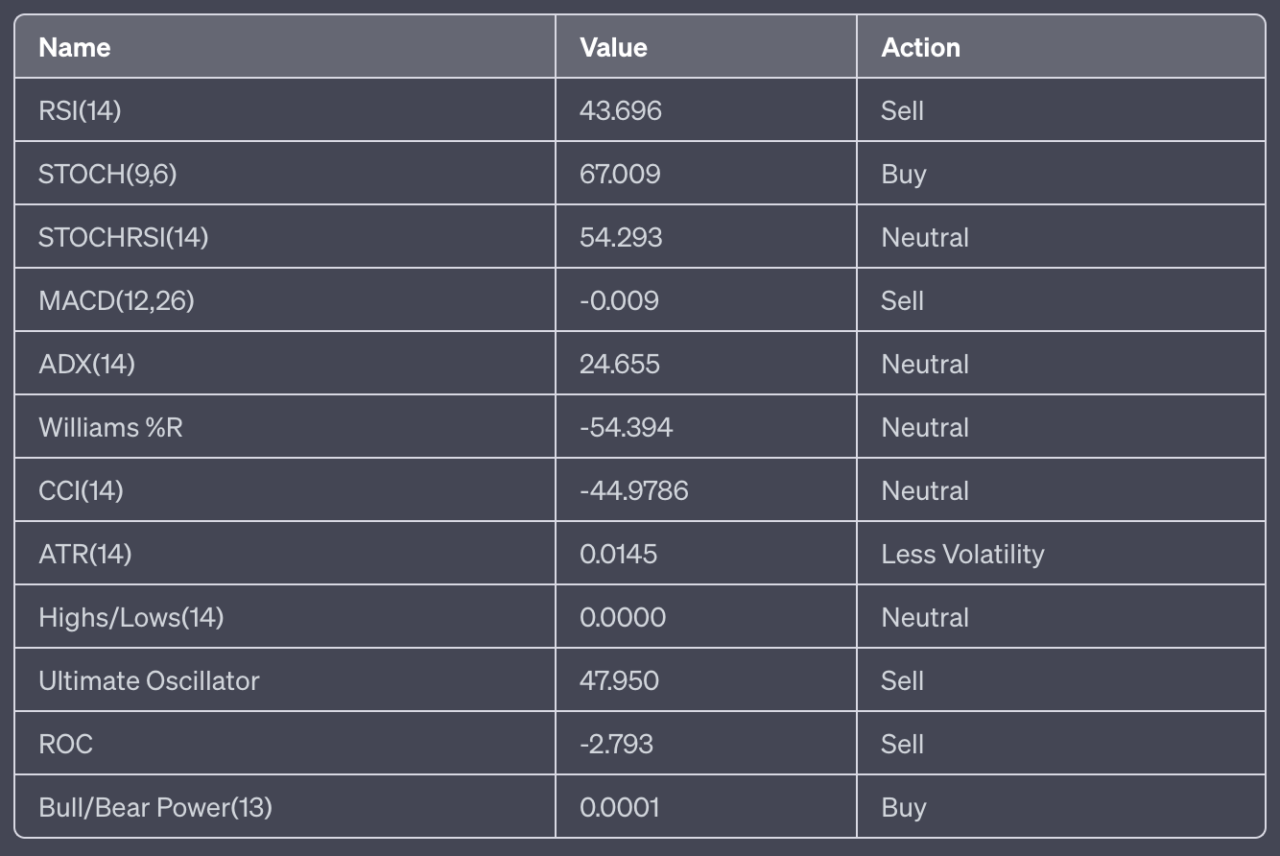
The daily technical indicators for ADA show a general “SELL” sentiment, with four sell signals, two buy signals, and five neutral signals.
Monthly

The monthly technical indicators for ADA show a “STRONG SELL” sentiment, with nine sell signals, 0 buy signals, and one neutral signal.
In summary, the daily technical indicators for Cardano (ADA) suggest a “Sell” signal, indicating that the price may decrease in the short-term. However, the monthly technical indicators suggest a “Strong Sell” signal, indicating a potential longer-term downward trend. This suggests that caution is advised for both short-term and long-term traders and investors.
Moving Averages
Moving averages smooth out price data to form a trend-following indicator. They do not predict price direction but rather define the current direction with a lag.
MA5, MA10, MA20, MA50, MA100, MA200: These are the 5-day, 10-day, 20-day, 50-day, 100-day, and 200-day moving averages respectively. They are calculated by adding up the closing prices over the specified number of days and then dividing by that number of days.
Moving averages are used to smooth out price data to help traders and investors identify and confirm trends over specific periods. They are calculated by averaging a cryptocurrency’s price over a certain number of days.
In the context of this report, we are looking at both daily and monthly moving averages.
- Daily Moving Averages: These are calculated using the closing prices of ADA over the past 5, 10, 20, 50, 100, and 200 days. Daily moving averages provide insights into the short-term trend of ADA and are more responsive to recent price changes.
- Monthly Moving Averages: These are calculated using the closing prices of ADA over the past 5, 10, 20, 50, 100, and 200 months. Monthly moving averages provide insights into the long-term trend of ADA and are less responsive to recent price changes but more indicative of long-term trends.
Here’s the daily and monthly moving averages data for Cardano (ADA) on 6 July 2023:
Daily Moving Averages

The daily moving averages for ADA show a “STRONG SELL” sentiment, with all 12 signals indicating a sell.
Monthly Moving Averages

The monthly moving averages for ADA show a “STRONG SELL” sentiment, with 11 sell signals and 1 buy signal.
In summary, both the daily and monthly moving averages suggest a “Strong Sell” signal for Cardano (ADA). This indicates that the price is generally trending downwards in the short and long term. However, the 200-month moving average indicates a “Buy” signal, suggesting that the price is above the average of the past 200 months, which could be a bullish signal in the very long-term context.
Conclusion
The technical analysis of Cardano (ADA) for 6 July 2023 reveals a bearish trend in both the short-term (daily) and long-term (monthly) timeframes. The majority of the technical indicators and moving averages signal a “Sell” or “Strong Sell” condition. This suggests that the market sentiment is predominantly negative for ADA at this time.
However, it’s important to note that market conditions can change rapidly, and past performance does not indicate future results. While the current analysis suggests a bearish trend, other factors, such as market news, global economic conditions, and changes in the cryptocurrency sector, can influence the price of ADA.
Investors and traders should use this technical analysis as one tool among many in their decision-making process. It’s also crucial to consider your personal risk tolerance and investment goals when making trading decisions.
Featured Image Credit: Photo / illustration by “Dylan Calluy” via Unsplash







