
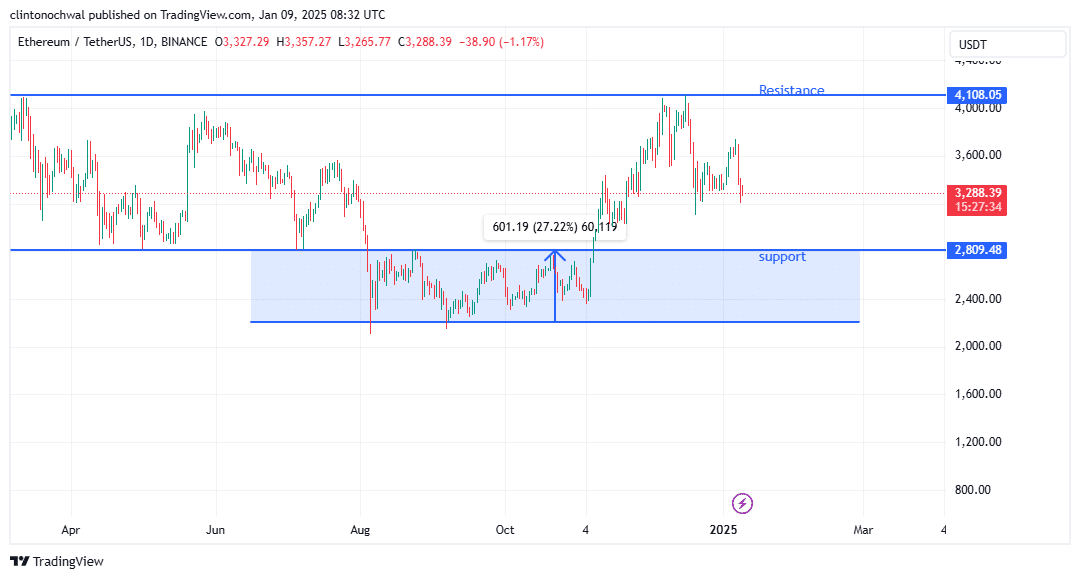
- Ethereum’s recent price action has revealed critical support and resistance levels that traders should monitor.
- As ETH broke below the $3,593.46 support, Open Interest in Ethereum Futures contracts initially rose.
Ethereum [ETH], the second-largest cryptocurrency by market capitalization, has recently broken below a key support level, sparking concerns among traders.
With Bitcoin [BTC] undergoing its own correction, Ethereum has shown signs of further retracement.
Analysts are eyeing $2,809 as a potential accumulation zone before a possible rebound. This setup suggests that a deeper correction might occur before the bullish momentum resumes.
Support and resistance levels
Ethereum’s recent price action has revealed critical support and resistance levels that traders should monitor. On the 4-day timeframe, Ethereum’s price movement remained defined by key levels of support and resistance.
There was a critical support zone at $2,809.48, while the nearest resistance stood at $4,108.05. These levels are important benchmarks for traders monitoring potential reversals or continuations in ETH’s trajectory.
Source: TradingView
The breakdown below $3,593.46 has confirmed bearish momentum, with the price hovering near $3,297.19 at press time.
This level sat closer to the mid-point between support and resistance, potentially signaling a consolidation phase before the next significant move.
If ETH tests the $2,809.48 support and holds, it may mark a strong accumulation zone for long-term traders. Conversely, failure to hold this level could lead to further declines, possibly triggering broader market bearishness.
Bears giving up?
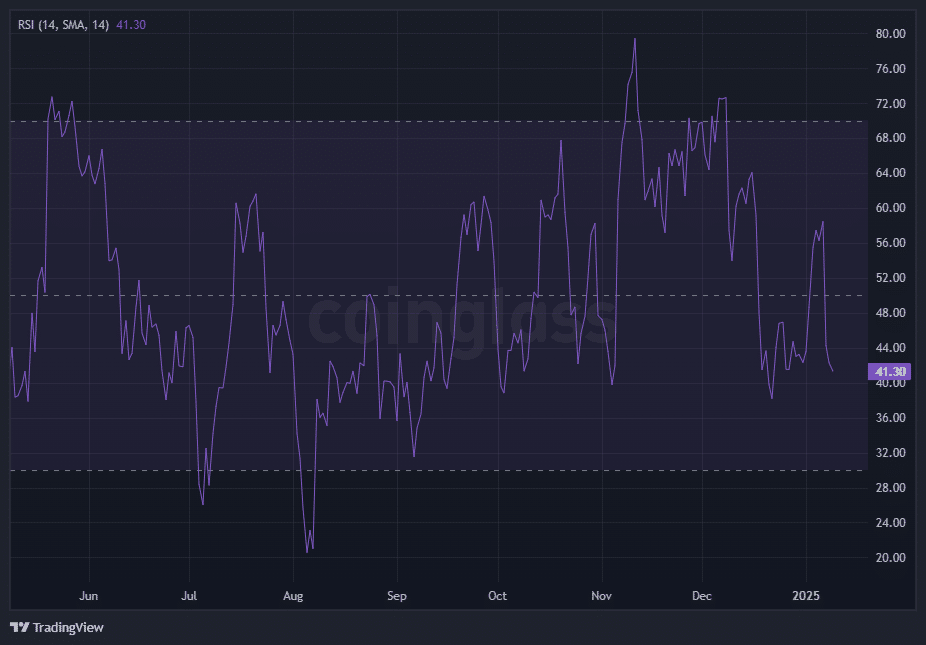
The Relative Strength Index (RSI) provides critical insights into Ethereum’s current momentum and potential price trajectory.
As shown in the chart, the RSI has been trending downward, reflecting increasing selling pressure and waning bullish strength.
With the RSI approaching the oversold threshold of 30, the market is signaling potential exhaustion of the recent bearish momentum.
Source: Coinglass
The RSI analysis remains crucial for understanding Ethereum’s momentum. Press time RSI levels, reflecting the updated price movement, suggested increasing selling pressure.
As ETH trends closer to $2,809.48, the RSI may dip further toward the oversold threshold of 30.
This would signal a potential bounce or consolidation, depending on market sentiment.
Traders should monitor for a decisive RSI rebound above 40, which could indicate a recovery aligned with movement toward $4,108.05. Failure to do so might result in ETH sustaining its bearish trajectory.
Ethereum: Assessing market sentiment
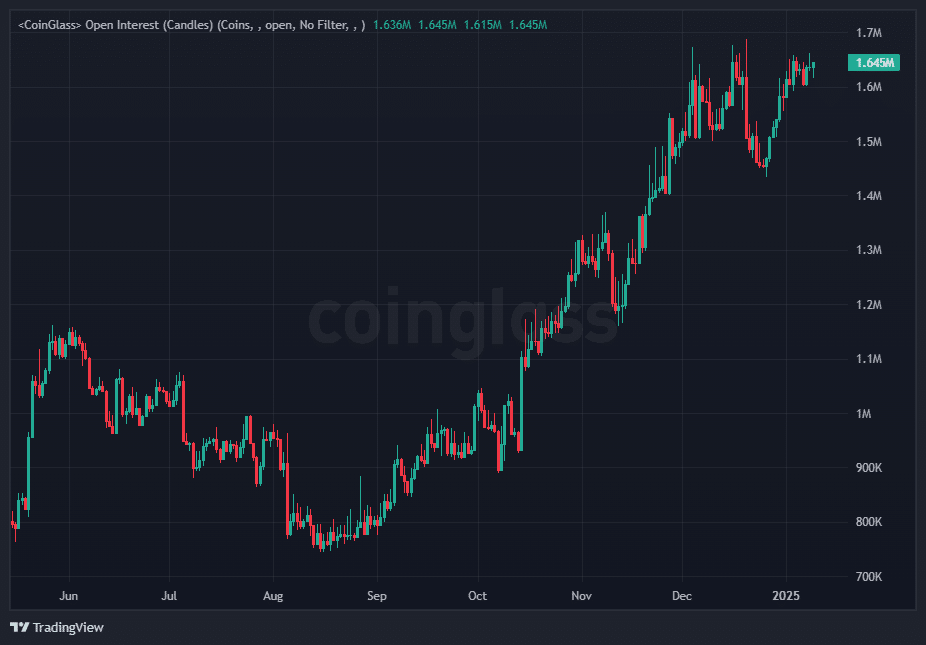
Open Interest, which reflects the total number of outstanding futures and options contracts, serves as a key metric for gauging market participation and sentiment.
In Ethereum’s case, the recent price decline has been accompanied by fluctuating levels, revealing important trends.
Source: Coinglass
As ETH broke below the $3,593.46 support, Open Interest in Ethereum Futures contracts initially rose. This suggested increased speculative activity as traders positioned themselves for further downside.
Rising Open Interest during a price drop often signals that bearish sentiment is intensifying, as more market participants anticipate continued declines.
However, following the sharp correction to $3,318.41, Open Interest began to stabilize, hinting at reduced speculative pressure and potential market indecision.
A significant drop in Open Interest at this stage might indicate a cooling market, with traders closing their positions and awaiting clearer signals.
Conversely, renewed increases in Open Interest, especially near the $2,807.13 support zone, could point to accumulation by long-term investors or heightened speculative interest in anticipation of a rebound.
Read Ethereum’s [ETH] Price Prediction 2025–2026
As external factors like Bitcoin’s correction continue to influence Ethereum’s performance, traders should remain cautious and closely monitor these key levels and metrics.
A bounce from the $2,807.13 support could reignite bullish momentum, while failure to hold this level might lead to deeper corrections.







