
While most crypto market watchers remain focused on Bitcoin’s ongoing struggle with $31,000, Ethereum recently closed above the psychologically important $2000 level for the first time in weeks. Now poised to close lower for four straight days, let’s take an evidence-based approach and determine whether four consecutive days lower for Ether is historically bullish or bearish going forward. Let’s dive in!
Ethereum’s Close Above $2000 Followed By Pullback
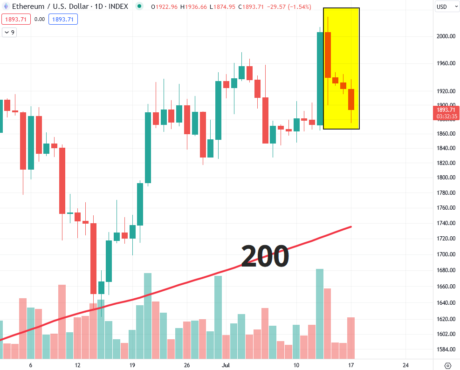
After closing at an impressive multi-week high and back above the $2000 level on July 13th, Ether has pulled back for four consecutive sessions, one of the conditions we’ll test momentarily. To better add context to the test, we’ll also add two more conditions requiring that [1] Ether is above its 200ma and that [2] its 200ma is rising. Why? The 200ma and its slope both act as simple filters to help determine market regime. For example, this latest four day pullback in Ether occurs in an improving market in which ETH is above the rising 200ma. If the current four day pullback were occurring in a down trending market regime, we would require that ETH be below its declining 200ma.

Ethereum daily chart | ETHUSD on TradingView.com
What does this pullback in Ethereum suggest for its price? To find out, we’ll look at all signals since inception, and also compare those signals to a simple “buy and hold” approach. This will provide us with a baseline to better understand today’s test results.
Four Days Down Compared To Buy And Hold
The holding time graphic below shows historical results for Ether’s current technical setup on top with a simple “buy and hold” approach on the bottom. In other words, we’ll show hypothetical results using various holding times solely for when Ethereum has closed lower for four straight days while above its rising 200ma on top. The bottom results will act as a baseline, assuming a hypothetical purchase of ETHUSD with no conditions whatsoever and an exit n-days later.

Average Trade Comparison | SOURCE: REKTelligence, Tableau
While both approaches show positive average trade results over every exit we tested from 7 days through 90 days, our baseline “buy and hold” actually outperforms the current technical setup of four days down. The single exception is the “exit in 90 days” in which the current setup slightly outpaces the historical average “buy and hold” trade, beating it 62.1% to 59.4%.
But while the average trade statistic remains important, it does not always tell the whole story. When looking at a comparison of the largest hypothetical losses for both approaches using the same conditions described earlier, note that the largest losses (i.e., worst trades) for the current four days down setup are far lower than for a simple “buy and hold” approach. This largest loss comparison indicates that while the current setup may not beat “buy and hold” in terms of average trade, Ethereum may currently have a lower than usual risk exposure – something most experienced traders will appreciate.

Largest Loss Comparison | SOURCE: REKTelligence, Tableau
While the past doesn’t predict future, based on our analysis, Ethereum looks poised for potential upside mostly in line with typical “buy and hold” expectations. In other words, not overly exciting and apparently lacking any meaningful edge at the moment. That said, risk also appears lower than usual relative to the “buy and hold” largest loss stats. Traders take note. Ethereum may now be offering its typical return profile based on its current technical setup, but with a lower overall risk exposure.
DB the Quant is the author of the REKTelligence Report newsletter on Substack. Follow @REKTelligence on Twitter for evidence-based crypto market research and analysis. Important Note: This content is strictly educational in nature and should not be considered investment advice.
Featured image from nadia_snopek/Adobe Stock. Charts from TradingView.com.







