
- Ethereum’s price surged to $3,380, marking a 4.6% hike within just 24 hours
- Recent whale deposits on Kraken, alongside rising OI, hinted at potential short-term price pressure
Ethereum (ETH), the second-largest cryptocurrency by market cap, continues to exhibit dynamic market trends in early 2025. A giant whale recently deposited 20,000 ETH (Valued at $67.6 million) into Kraken, reigniting discussions about large-scale investor activity and its influence on Ethereum’s price movement.
This whale, who once withdrew 217,513 ETH from exchanges in September 2022, has been actively engaging with Kraken since March 2024.
Such moves often signal significant shifts in market sentiment and liquidity, prompting traders to evaluate key indicators and prepare for potential price changes.
A closer look at Ethereum’s market performance
On the back of weaker-than-expected CPI data, Ethereum’s price climbed to $3,380 after gains of almost 5% in 24 hours. Its 24-hour trading volume hit an impressive $26.2 billion, highlighting robust market activity and significant interest from both retail and institutional investors. Similarly, the altcoin’s market cap sat at $407.2 billion – A sign of steady investor confidence despite periods of heightened volatility.
The aforementioned whale’s latest 20,000 ETH deposit seemed to be in line with Ethereum’s latest price peak, hinting at potential profit-taking or anticipation of a price correction. Historically, large-scale deposits by whales have preceded bouts of sell pressure on ETH’s price due to greater sell-side liquidity. However, this pattern is not always definitive.
External factors such as macroeconomic developments and Bitcoin’s price correlation also play a crucial role in Ethereum’s trajectory. As Bitcoin stabilizes above $95,000, Ethereum traders can anticipate sustained bullish momentum. Additionally, the expansion of ETH staking and the deflationary effect of EIP-1559 further bolsters its long-term appeal.
ETH’s price action and key indicators
Ethereum’s price has seen significant volatility, shaped by both technical factors and large-scale investor activity. In fact, over the past year, ETH’s price has moved within a range of $1,500 to $4,500, demonstrating both bullish and bearish phases.
Here, it’s worth pointing out that the whale’s deposit history lends some insight into potential future price movements. Between March 2024 and now, this whale deposited 146,639 ETH to Kraken at an average price of $3,170 – A sign of strategic profit-taking at higher price levels.
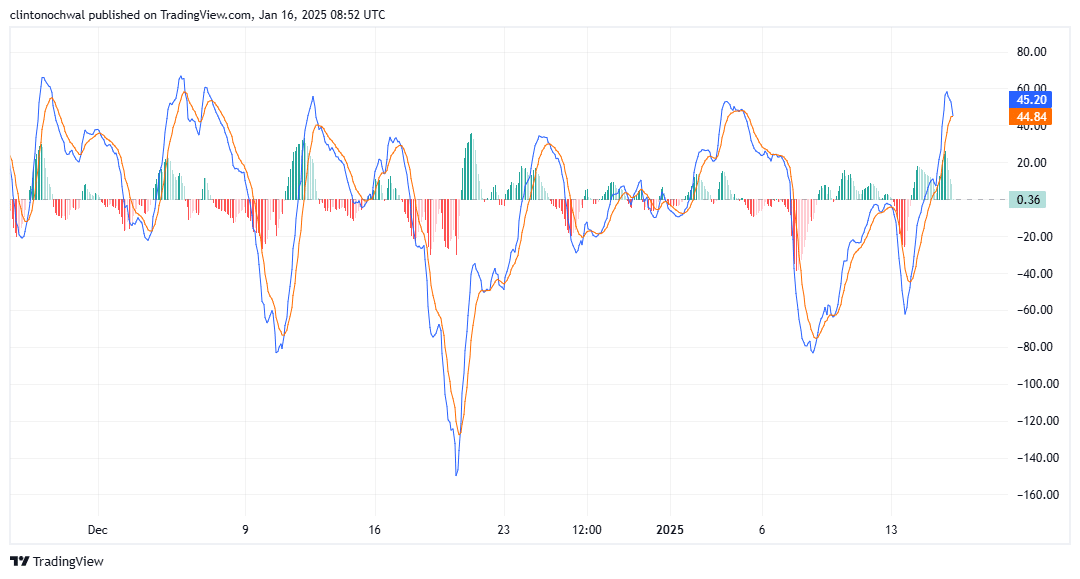
Source: TradingView
Technical analysis also revealed that ETH’s recent rally tested a strong resistance level at $3,400. Breaking past this level could pave the way for Ethereum to challenge the $3,500-$3,600 range in the short term. Conversely, a failure to maintain momentum could push ETH towards the $3,200-$3,100 support zone.
An examination of key moving averages also highlighted that Ethereum has been trading above its 50-day and 200-day moving averages.
Ethereum’s network resilience
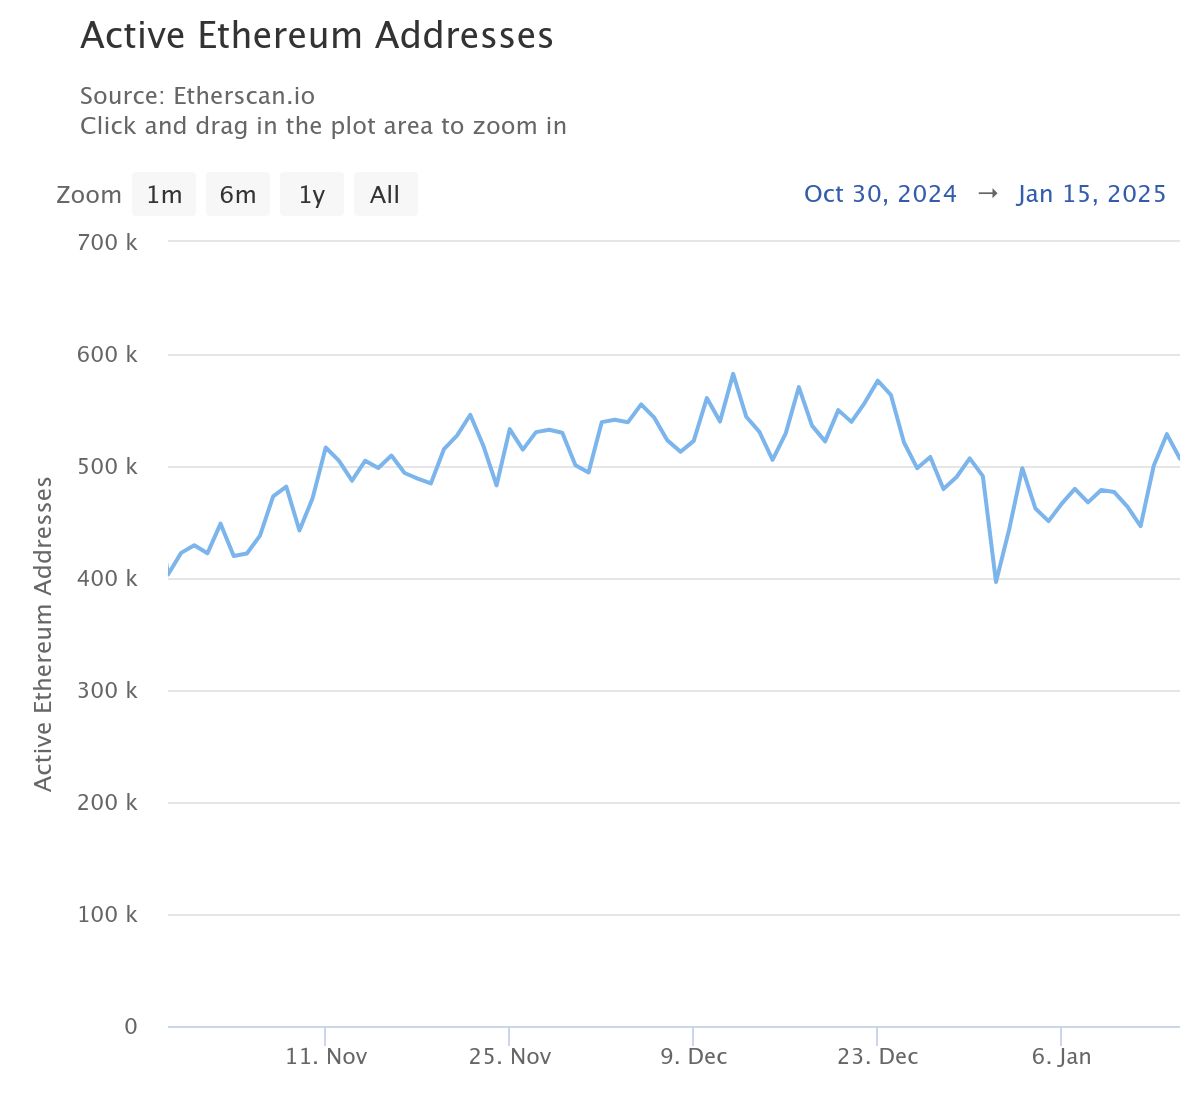
Additionally, Ethereum’s active addresses saw a steady uptick over the last few months. In fact, on-chain data revealed that active addresses consistently hovered around 400,000 daily, demonstrating strong participation across the ecosystem.
Source: Etherscan
When analyzing the trend further, one can see that periods of rising active addresses have often coincided with price rallies – A sign of growing demand and network utility. For example – The recent hike in active addresses aligned with Ethereum’s price surge to $3,380, reinforcing the correlation between network activity and market performance.
However, a decline in this metric, on the other hand, may mean reduced network activity and potential downward pressure on ETH’s price. In light of Ethereum’s robust developer ecosystem and continuous innovation, the network’s activity levels are likely to remain a reliable barometer of market sentiment and future price movements.
Signals for Ethereum’s next move
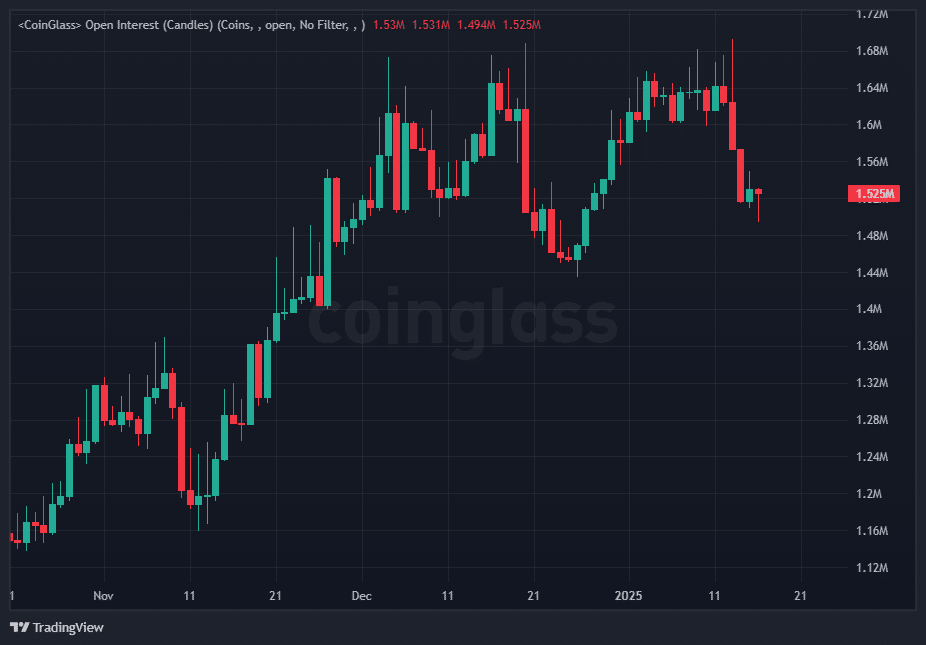
Ethereum’s Open interest (OI) has recently recorded notable fluctuations, indicating heightened activity in the derivatives market. At the time of writing, Ethereum’s OI across major exchanges stood at $1.52 million following a significant weekly hike. This hike corresponded with ETH’s latest price rally, meaning that traders are entering new positions in anticipation of further volatility.
Source: Coinglass
Spikes in open interest have often preceded significant price movements, as they indicate greater participation and leverage in the market.
The recent whale deposits on Kraken, alongside rising OI, hinted at potential short-term price pressure. If the majority of positions are long, a sudden market downturn could trigger liquidations, accelerating the decline. Conversely, sustained buying pressure might lead to a short squeeze, propelling ETH’s price higher.
Gauging Ethereum’s market sentiment
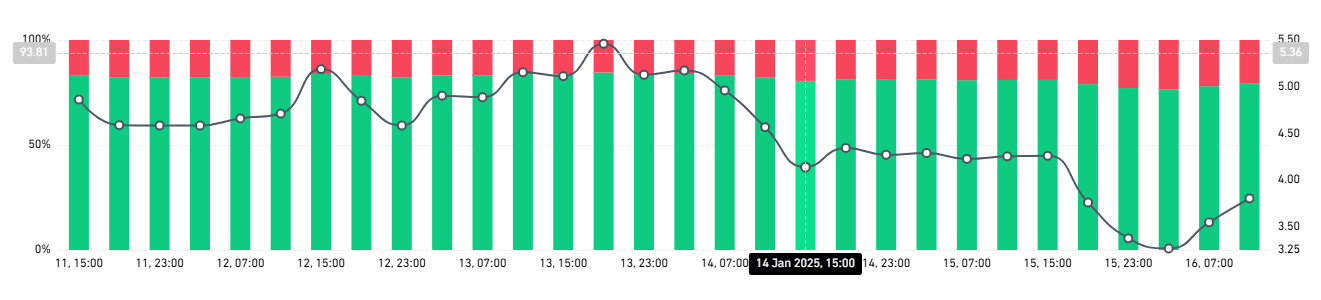
Finally, Ethereum’s MVRV ratio indicated that long-term holders are in significant profit, while short-term holders face tighter margins. This disparity highlighted the market’s bullish sentiment, with long-term holders benefiting from the recent price surge.
Source: Coinglass
When the MVRV ratio for long-term holders peaks, it often means an approaching local price top. Especially as profit-taking by these holders can introduce sell pressure.
Conversely, a declining MVRV ratio for short-term holders might indicate undervaluation and potential buying opportunities. At the time of writing, Ethereum’s MVRV ratio seemed to be nearing critical levels where long-term holders might begin to realize profits, posing a potential short-term correction risk.







