
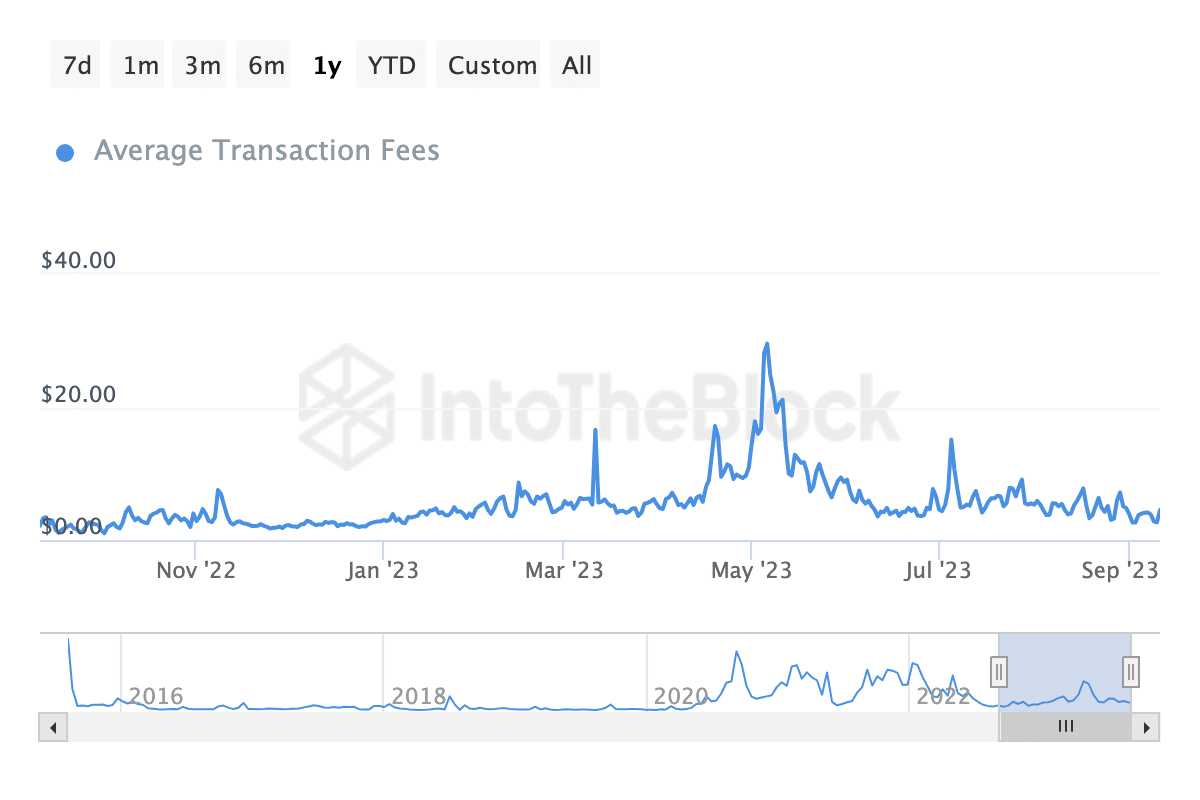
- Transaction fees on Ethereum have dropped to levels not seen since November last year.
- The decline in on-chain activity has caused Ethereum to become inflationary.
Average fees paid to process transactions on leading Layer 1 (1) network Ethereum [ETH] have plummeted to their lowest levels since 2022 due to a steady decline in on-chain activity in the past few months.

Source: IntoTheBlock
Read Ethereum’s [ETH] Price Prediction 2023-24
Taking a look back
In the year’s first half, data tracked by Token Terminal revealed that Ethereum led as the blockchain network with the highest count of fee-paying users. The cumulative transaction fees paid to use the blockchain network during that period totaled $1.3 billion.
As user activity intensified on the blockchain, the median transaction fee on the network rose to its year-to-date highest level by 5 May. According to data from Dune Analytics, on that day, the median transaction fee paid to complete transactions on Ethereum was 142 GWEI, representing the highest level in the previous twelve months.

Source: Dune Analytics
Reason behind the surge
The surge in user activity could be primarily attributed to the memecoin frenzy that had the entire crypto ecosystem in a chokehold between April and early June. This was driven mainly by the launch of the meme token Pepe [PEPE] on the Ethereum network on 15 April.
Shortly after the meme coin’s launch, it saw a significant uptick in trading volume, which pushed its value to astronomical highs. Data tracked by CoinMarketCap revealed that within a few weeks of trading, PEPE’s price climbed by over 6500%.
Many “aped in” on the meme coin, pushing the number of token holders to over 50,000 in just 14 days of existence. Fueled by its addition to Binance’s Innovation Zone on 5 May, the market capitalization of the meme coin briefly crossed the $1 billion mark.
54,000+ $PEPE holders in just 2 weeks? 🤯
Impressive, but let’s not forget the 1.3 million $SHIB holders out there!
And did you know that over 3,350 wallets hold both memecoins?
Let’s dive into the top holders of these two 👇 pic.twitter.com/VmJPdJZQEY
— Nansen 🧭 (@nansen_ai) April 30, 2023
Apart from the “degen” activity around PEPE, increased non-fungible tokens (NFTs) trading also contributed to the growth in on-chain activity on Ethereum. According to CryptoSlam, Ethereum recorded a cumulative $1.7 billion in NFT sales volume in the first two months of the year, logging a month-on-month growth of 39% jump between January and February.
Further, trading volume on decentralized exchanges (DEXes) housed within Ethereum rallied significantly between January and March, according to data from Artemis. Between 1 January and 10 March, the total volume of transactions completed through Ethereum-based on-chain DEXes increased by more than 3000%
Then the fall came…
After its brief stint at the “top,” PEPE’s trading volume waned steadily. As fewer investors transacted the altcoin, user activity on Ethereum trended downward. This resulted in a decline in gas fees on the network. This stood at 11.1 GWEI at press time, falling by 92% from the 5 May peak.
Regarding NFT activity on the blockchain, this was beaten down by the general decline in market interest in the asset category. Since February, the sales volume of Ethereum-minted NFTs has dropped by 77%. For context, in February, sales volume totaled $969 million. By the end of August, this was less than $250 million.

Source: CryptoSlam
As for the chain’s DEX trading volume, it has trended downward since the 10 March peak. Data from Artemis showed that at 1.32 billion as of 11 September, it has fallen by 94% in just six months.

Source: Artemis
ETH supply climbs once again
As a result of the dwindling on-chain activity and declining gas fees, Ethereum has entered an inflationary period. This means that new Ether tokens are being created and added to the circulating supply.
Is your portfolio green? Check out the ETH Profit Calculator
According to data from Ultrasound.money, ETH’s supply has risen by 3500 ETH coins in the last week, with an approximate value of $5.52 million. At press time, the leading altcoin’s circulating supply was 120.21 million ETH.

Source: Ultrasound.money
The issuance of new tokens and the resulting increase in supply could have a negative impact on ETH’s price. This is because scarcity is known to be a major driver of its price appreciation.







