
Este artículo también está disponible en español.
Ethereum has begun the year much like it ended the last—under a bearish cloud. The altcoin leader has faced a challenging start, with its price plummeting over 16% since January 6. Weak price action continues to dominate as ETH struggles to find strong support, leaving investors cautious about what lies ahead.
Related Reading
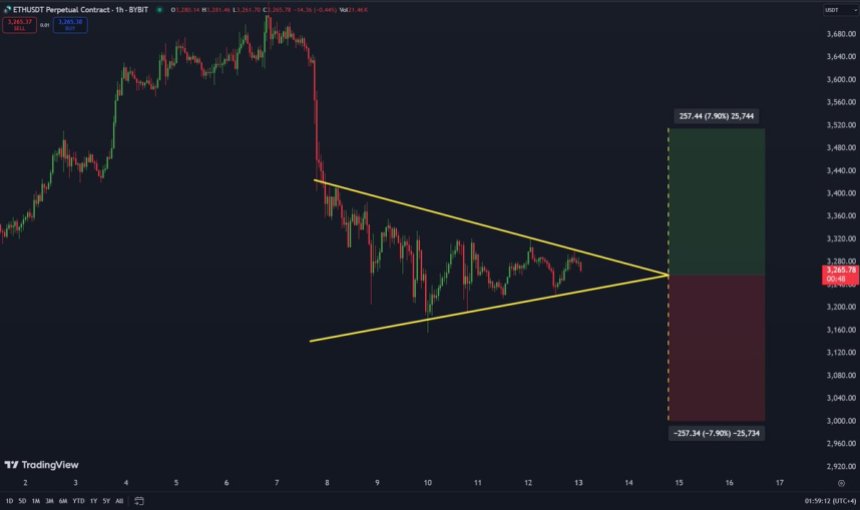
Amid the market uncertainty, top analyst Carl Runefelt has shared a technical analysis on X, offering insight into Ethereum’s potential next move. Runefelt highlights that ETH is forming a symmetrical triangle pattern on the 1-hour timeframe—a setup that typically precedes a significant price move. According to his analysis, this formation signals a period of consolidation that could lead to either a bullish breakout or a bearish breakdown.
A breakout could provide much-needed optimism for Ethereum investors, potentially reversing the bearish trend and pushing the price toward higher levels. On the other hand, a breakdown could extend ETH’s current losses, raising concerns about deeper corrections in the near term. As the market waits for clarity, all eyes are on Ethereum’s next move, which could set the tone for its performance in the coming weeks.
Ethereum Struggle: What’s Next For The Altcoin Leader?
Ethereum investors are facing challenging times, with price action continuing to disappoint. After briefly holding key demand levels, many expected a shift in market sentiment. However, ETH has now fallen to its lowest price since late December, leaving investors anxious about its next move.
Top analyst Carl Runefelt recently shared a technical analysis on X, shedding light on Ethereum’s current situation. Runefelt revealed that ETH is forming a symmetrical triangle pattern on the 1-hour timeframe—a structure that suggests a significant price move is imminent. The pattern highlights critical levels on both sides of the market, providing a roadmap for potential outcomes.
If Ethereum fails to hold above the $3,000 level, a deeper correction is likely, which could push the price significantly lower. Conversely, reclaiming the $3,500 level would signal strength, setting the stage for a massive breakout. Such a move would not only restore investor confidence but also attract new capital into the market.
Related Reading
The market as a whole is at a crossroads, with Bitcoin holding above key support levels while altcoins, including Ethereum, continue to experience selling pressure. As traders closely monitor ETH’s next move, its performance in the coming days could set the tone for the broader altcoin market.
ETH Tests Crucial Support Levels Amid Downtrend
Ethereum is trading at $3,113 after a 6% decline in the past few hours, signaling continued bearish pressure in the market. The price is now testing the daily 200 exponential moving average (EMA) at this level, a critical technical indicator that could determine the direction of the next move. Holding this EMA as support might spark a bullish recovery, giving ETH the momentum needed to reclaim higher levels in the coming sessions.
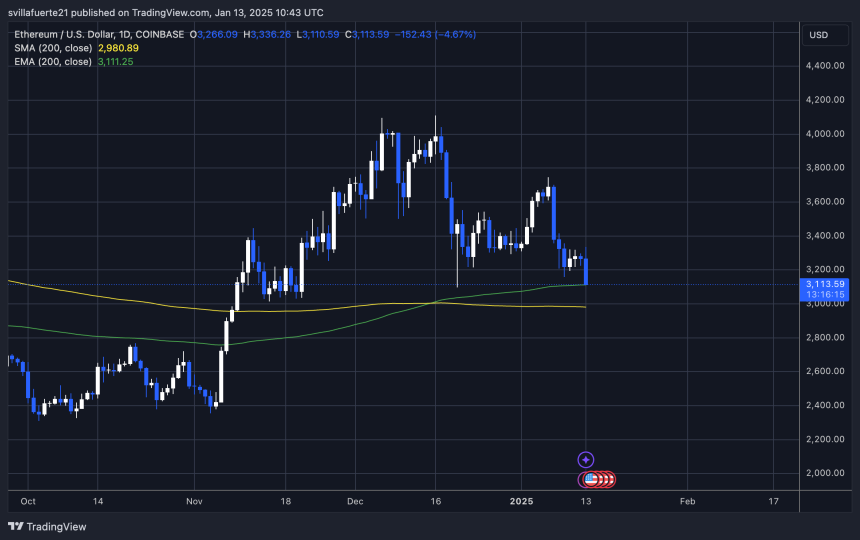
However, the market remains on edge, and the key level to watch for support is the untested $3,000 mark. This psychological and technical level hasn’t been revisited since late November, making it a significant zone of interest for both bulls and bears. A drop to this level could attract strong buying interest, potentially setting the stage for a rebound.
Related Reading
On the flip side, if ETH fails to hold the daily 200 EMA or loses the $3,000 level, a deeper correction could ensue, potentially driving the price into new lows for 2025. With market sentiment leaning bearish and key supports being tested, Ethereum’s price action in the next few days will be pivotal in shaping its short-term trend.
Featured image from Dall-E, chart from TradingView







