
An analyst has explained how Ethereum is retesting a breakout zone currently and that this might lead toward a price target of $3,500.
Ethereum Is Retesting The Breakout Line Of An Ascending Triangle
As pointed out by analyst Ali in a new post on X, Ethereum may be preparing for a further climb right now as it’s retesting the breakout zone of an ascending triangle.
An “ascending triangle” is a pattern in technical analysis that, as its name implies, resembles a triangle. The pattern involves a horizontal line made by connecting highs and a slant line that strings together higher lows.
When the price retests the upper, horizontal level, it could be probable to feel some resistance. On the other hand, a touch of the lower level could lead to the price rebounding back up.
A break out of either of these lines suggests a potential sustained continuation of the trend. Naturally, an escape out of the triangle towards the upside implies bullish momentum, while a fall under means bearish momentum.
Like the ascending triangle, there is also the “descending triangle,” which is a similar pattern except for the fact that the two levels are switched around (as the prevailing trend is towards the downside).
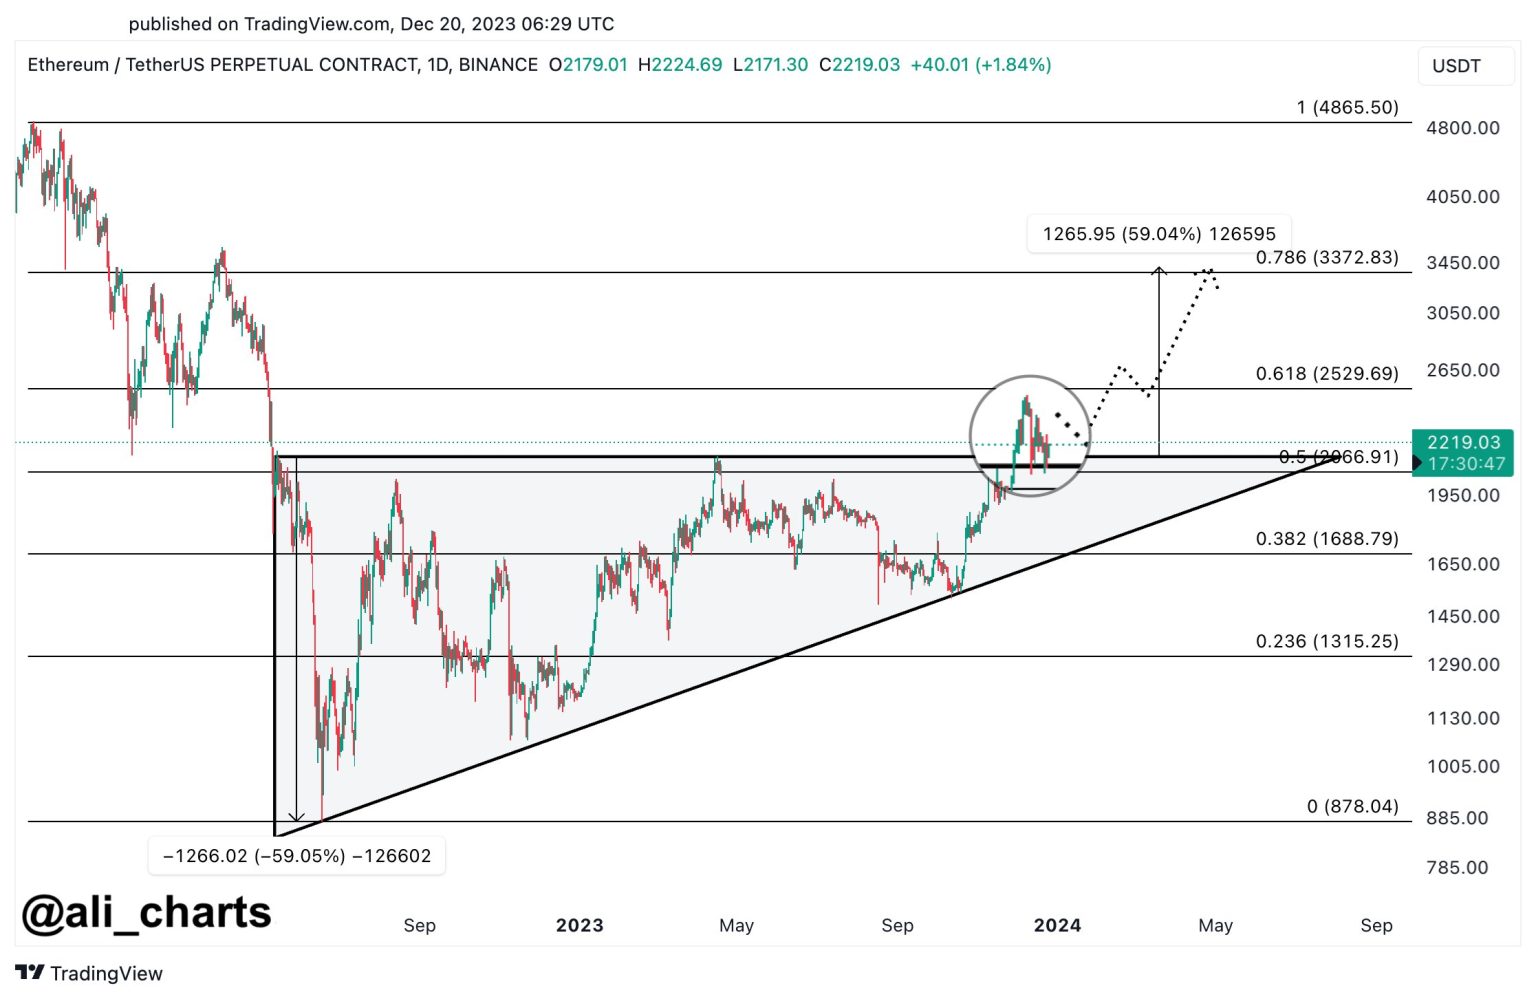
Now, here is the chart shared by Ali that displays how the price is interacting with an ascending triangle right now:
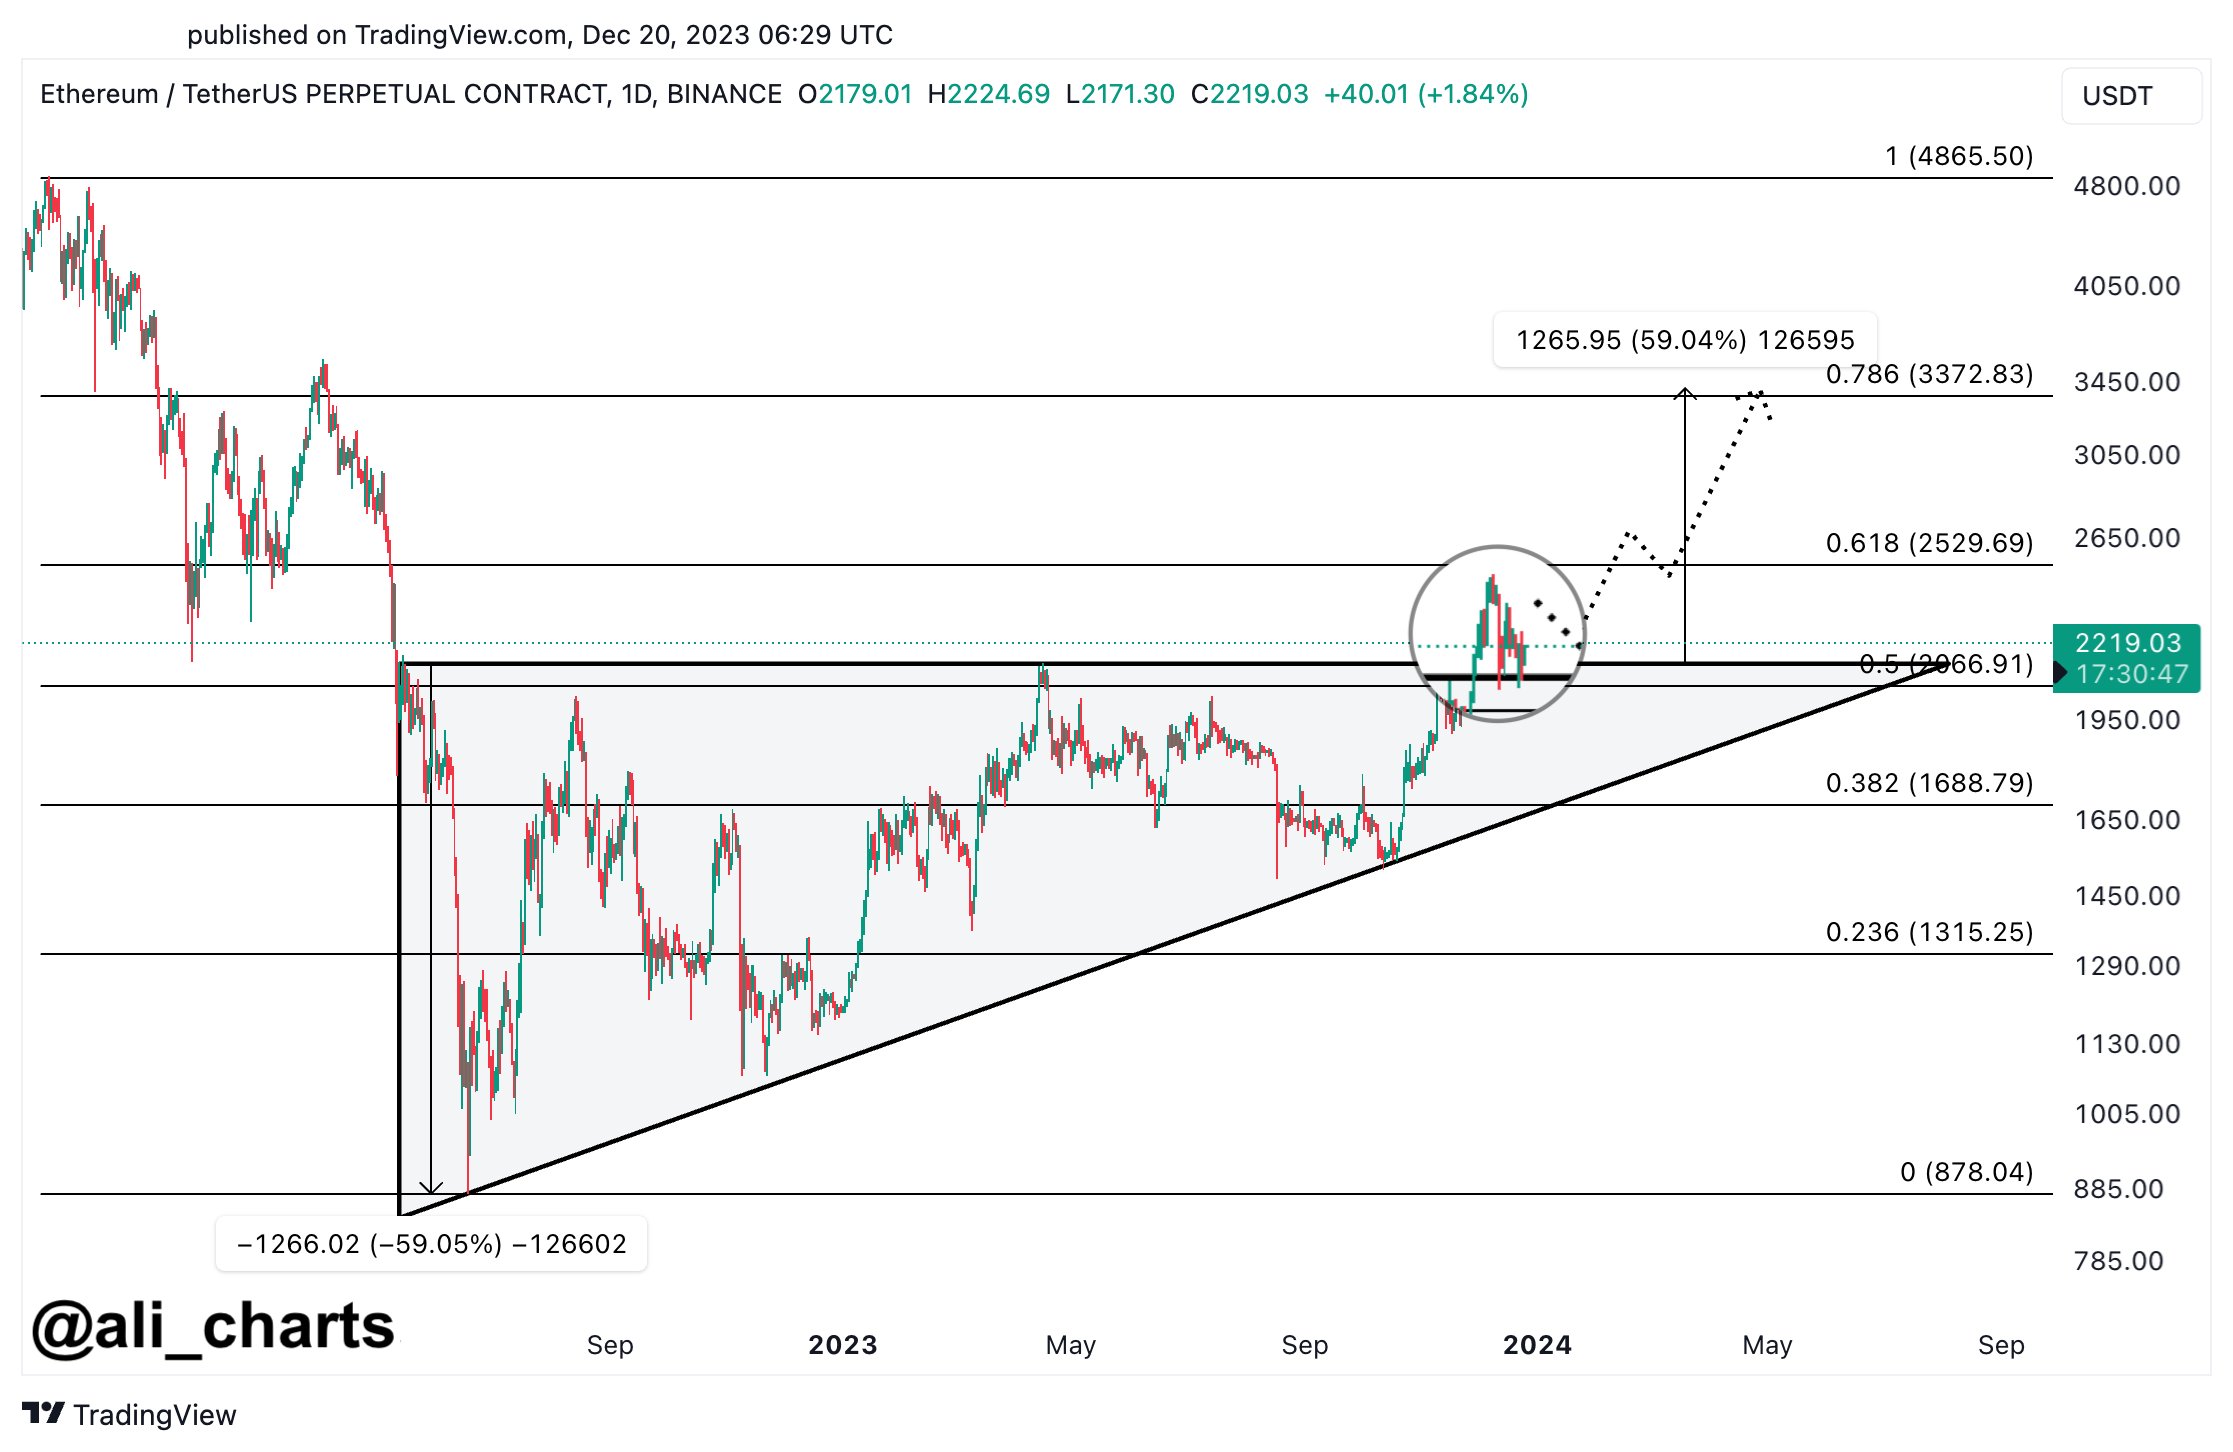
Looks like the asset's value has plunged back towards the triangle in recent days | Source: @ali_charts on X
As is visible in the graph, Ethereum found a bottom at the lower line of this ascending triangle pattern back in October. Following this low, the asset turned itself around with a sharp rally and went on to challenge the upper line.
The cryptocurrency succeeded in finding a break above the triangle and observed a continuation of the bullish momentum, exploring new highs for the year. Recently, though, the asset has slumped back again and has now fallen towards the triangle’s breakout line.
So far, the line has provided support to the asset, as its price has been able to remain above it. The analyst believes that this retest could be a sign that the coin is preparing for a further rally.
“The price range between $2,150 and $1,900 could be the ideal zone for accumulation before ETH sets its sights on a higher target of $3,500,” explains Ali. From the current price, such a target would mean a rally of almost 60% for the asset.
October, the month when Ethereum turned itself around off the triangle’s slope, was also an inflection point for the asset in terms of on-chain activity, as the analytics firm Glassnode has explained in its latest weekly report.

The trend in three on-chain indicators for ETH | Source: Glassnode's The Week Onchain - Week 51, 2023
From the chart, it’s visible that the Ethereum transaction count and transfer volume have both been trending up since the inflection point a couple of months back, which could be bullish for the price.
ETH Price
Ethereum has gone a bit stale recently as it has been consolidating around the $2,200 mark.
The price of the coin appears to have been moving sideways recently | Source: ETHUSD on TradingView
Featured image from Kanchanara on Unsplash.com, charts from TradingView.com, Glassnode.com
Disclaimer: The article is provided for educational purposes only. It does not represent the opinions of NewsBTC on whether to buy, sell or hold any investments and naturally investing carries risks. You are advised to conduct your own research before making any investment decisions. Use information provided on this website entirely at your own risk.







