• Crypto
    • Bitcoin
    • Ethereum
    • Altcoins
    • Cardano
    • Solana
  • Web 3
    • Metaverse
    • NFT
  • Blockchain
  • Analysis
  • Learn
  • AI & VR
  • Gaming
  • Marketcap
  • Shop
What's Hot

Is Staking Crypto Safe? What You Should Know Before Staking

September 15, 2026

What Is the CLARITY Act and What Does It Mean for Crypto?

September 14, 2026

What Is Cross Margin in Crypto? How It Works, Risks, and Examples

September 14, 2026
Facebook Twitter Instagram
  • Contact
  • Disclosure
  • Privacy Policy
  • Terms & conditions
Facebook Twitter Instagram
VIP Crypto Signals
  • Crypto
    • Bitcoin
    • Ethereum
    • Altcoins
    • Cardano
    • Solana
  • Web 3
    • Metaverse
    • NFT
  • Blockchain
  • Analysis
  • Learn
  • AI & VR
  • Gaming
  • Marketcap
  • Shop
VIP Crypto Signals
Home » Blog » Ethereum’s Plunge Could Be Over: This Key Pattern Signals A Rally Back To $4,000
Ethereum

Ethereum’s Plunge Could Be Over: This Key Pattern Signals A Rally Back To $4,000

September 5, 2024No Comments3 Mins Read
Share
Facebook Twitter LinkedIn Pinterest Email

Much like Bitcoin, Ethereum has faced significant challenges in recent months, struggling to sustain any major price rally. After reaching a peak of over $4,000 in March, Ethereum has been consistently declining, failing to break out of this bearish trend.

So far, the second-largest cryptocurrency by market cap has seen its price drop by over 5.9% in the past two weeks, and it continues to hover around the $2,400 mark. Currently trading at $2,434, Ethereum has fallen 2.4% in the last week and 0.4% in the last 24 hours.

Is A Rebound To $4,000 Around The Corner?

Despite this downturn, market analysts remain optimistic about a potential turnaround. According to a recent post by ‘The Moon’ on X, Ethereum might be primed to rally back to $4,000—if certain technical conditions are met.

Particularly, The Moon highlighted Ethereum’s current 1D Falling Wedge formation, a common chart pattern in technical analysis often indicating a potential reversal. The analyst stated, “Once a breakout occurs, there’s a strong possibility Ethereum could rise back to $4K.”
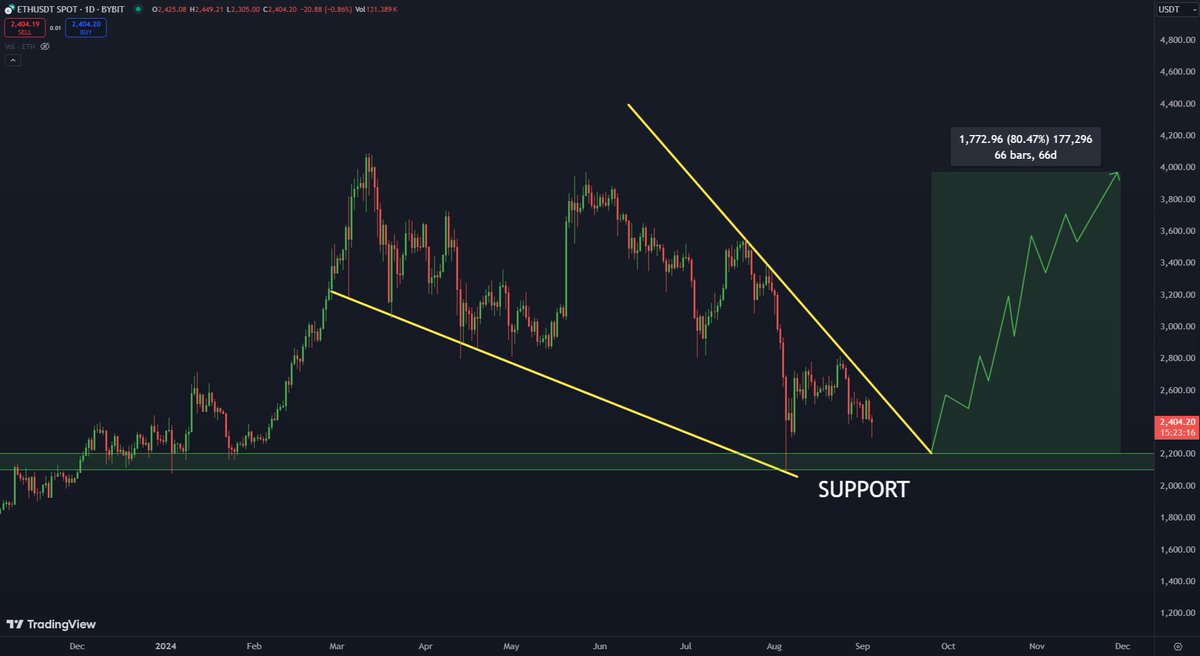
Facing Wedge Pattern on the Ethereum chart

For context, a falling wedge in technical analysis is a pattern where the price of an asset is in a downtrend but within a narrowing range.

This pattern usually suggests that downward momentum is weakening, and once the price breaks above the wedge, a reversal could occur. This is what The Moon predicts for Ethereum—a potential breakout could lead to a surge back to previous highs.

Ethereum (ETH) price chart on TradingView

Ethereum Experiencing Rise In Bullish Sentiments

Meanwhile, other analysts in the crypto community have shared similar bullish sentiments about Ethereum’s future performance. Renowned crypto analyst Crypto Jack has pointed out that Ethereum’s price is nearing a key long-term support level.

See also  More Ethereum whales exit the market - Are they giving up?

Jack said a bounce from $2,200 could signal a strong reversal and potentially lead to a bullish trend. This long-term support level could be crucial for Ethereum as it tries to regain momentum after weeks of sluggish performance.

The price of $ETH is approaching long term support.

A bounce from $2.2k for #Ethereum could be extremely bullish. pic.twitter.com/pepeDZm5FA

— CryptoJack (@cryptojack) September 4, 2024

Adding to the bullish outlook is crypto analyst Mags, who recently noted on X that Ethereum is currently trading inside a massive triangle pattern.

According to Mags, this formation, combined with the possibility of a double bottom near the upward-sloping trendline, could signal that Ethereum is poised for a significant upward move.
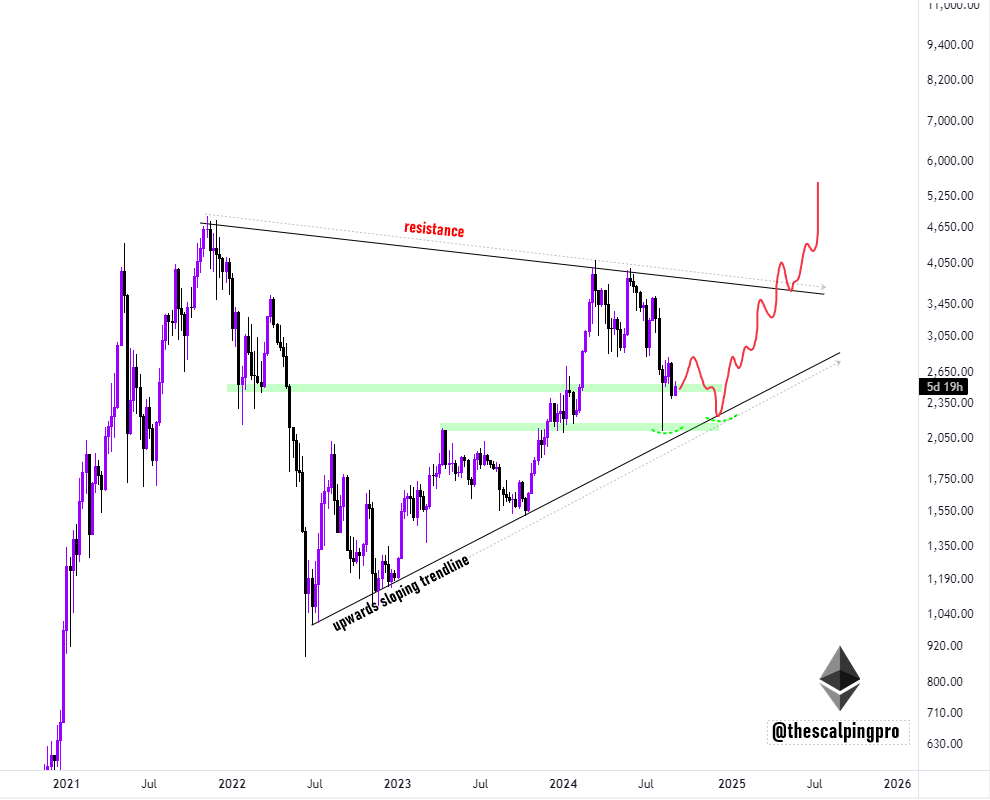
Ethereum chart.

A double bottom occurs when an asset forms two low points at roughly the same price level, indicating strong support and the potential for a bullish reversal.

Featured image created with DALL-E, Chart from TradingView



Source link

Ethereums key Pattern plunge rally Signals
Share. Facebook Twitter Pinterest LinkedIn Tumblr Email

Related Posts

What Is the Evening Star Candlestick Pattern in Crypto?

June 29, 2026

What Is a Bull Flag Pattern in Crypto and How to Use It

June 20, 2026

Triple Top Chart Pattern in Crypto: How to Spot and Confirm It

June 12, 2026

Doji Candlestick Pattern in Crypto: How to Read and Use It

June 12, 2026
Add A Comment

Leave A Reply Cancel Reply

Top Posts

Is Staking Crypto Safe? What You Should Know Before Staking

September 15, 2026

What Is the CLARITY Act and What Does It Mean for Crypto?

September 14, 2026

What Is Cross Margin in Crypto? How It Works, Risks, and Examples

September 14, 2026

Subscribe to Updates

Get the latest news and Update from VIP Crypto Signals about Crypto, Web3, Metaverse, NFT and more.

Our mission is to develop a community of people who try to make financially sound decisions. The website strives to educate individuals in making wise choices about Cryptocurrencies, NFT, Metaverse and more.

We're social. Connect with us:

Facebook Twitter Instagram Pinterest YouTube
Top Insights

Is Staking Crypto Safe? What You Should Know Before Staking

September 15, 2026

What Is the CLARITY Act and What Does It Mean for Crypto?

September 14, 2026

What Is Cross Margin in Crypto? How It Works, Risks, and Examples

September 14, 2026
Get Informed

Subscribe to Updates

Get the latest news and Update from VIP Crypto Signals about Crypto, Web3, Metaverse, NFT and more.

Facebook Twitter Instagram Pinterest
  • Contact
  • Disclosure
  • Privacy Policy
  • Terms & conditions
© 2026 Vip Crypto Signals - All rights reserved.

Type above and press Enter to search. Press Esc to cancel.

  • FibSwap DEXFibSwap DEX(FIBO)$0.0084659.90%
  • bitcoinBitcoin(BTC)$70,953.006.13%
  • ethereumEthereum(ETH)$3,664.5818.50%
  • tetherTether(USDT)$1.00-0.01%
  • binancecoinBNB(BNB)$627.698.99%
  • solanaSolana(SOL)$181.131.69%
  • staked-etherLido Staked Ether(STETH)$3,662.5418.48%
  • usd-coinUSDC(USDC)$1.00-0.02%
  • rippleXRP(XRP)$0.545.05%
  • dogecoinDogecoin(DOGE)$0.1634778.14%

