• Crypto
    • Bitcoin
    • Ethereum
    • Altcoins
    • Cardano
    • Solana
  • Web 3
    • Metaverse
    • NFT
  • Blockchain
  • Analysis
  • Learn
  • AI & VR
  • Gaming
  • Marketcap
  • Shop
What's Hot

Is Staking Crypto Safe? What You Should Know Before Staking

September 15, 2026

What Is the CLARITY Act and What Does It Mean for Crypto?

September 14, 2026

What Is Cross Margin in Crypto? How It Works, Risks, and Examples

September 14, 2026
Facebook Twitter Instagram
  • Contact
  • Disclosure
  • Privacy Policy
  • Terms & conditions
Facebook Twitter Instagram
VIP Crypto Signals
  • Crypto
    • Bitcoin
    • Ethereum
    • Altcoins
    • Cardano
    • Solana
  • Web 3
    • Metaverse
    • NFT
  • Blockchain
  • Analysis
  • Learn
  • AI & VR
  • Gaming
  • Marketcap
  • Shop
VIP Crypto Signals
Home » Blog » Ethereum’s price rally: What makes THIS level a make-or-break point
Ethereum

Ethereum’s price rally: What makes THIS level a make-or-break point

June 25, 2024No Comments3 Mins Read
Share
Facebook Twitter LinkedIn Pinterest Email
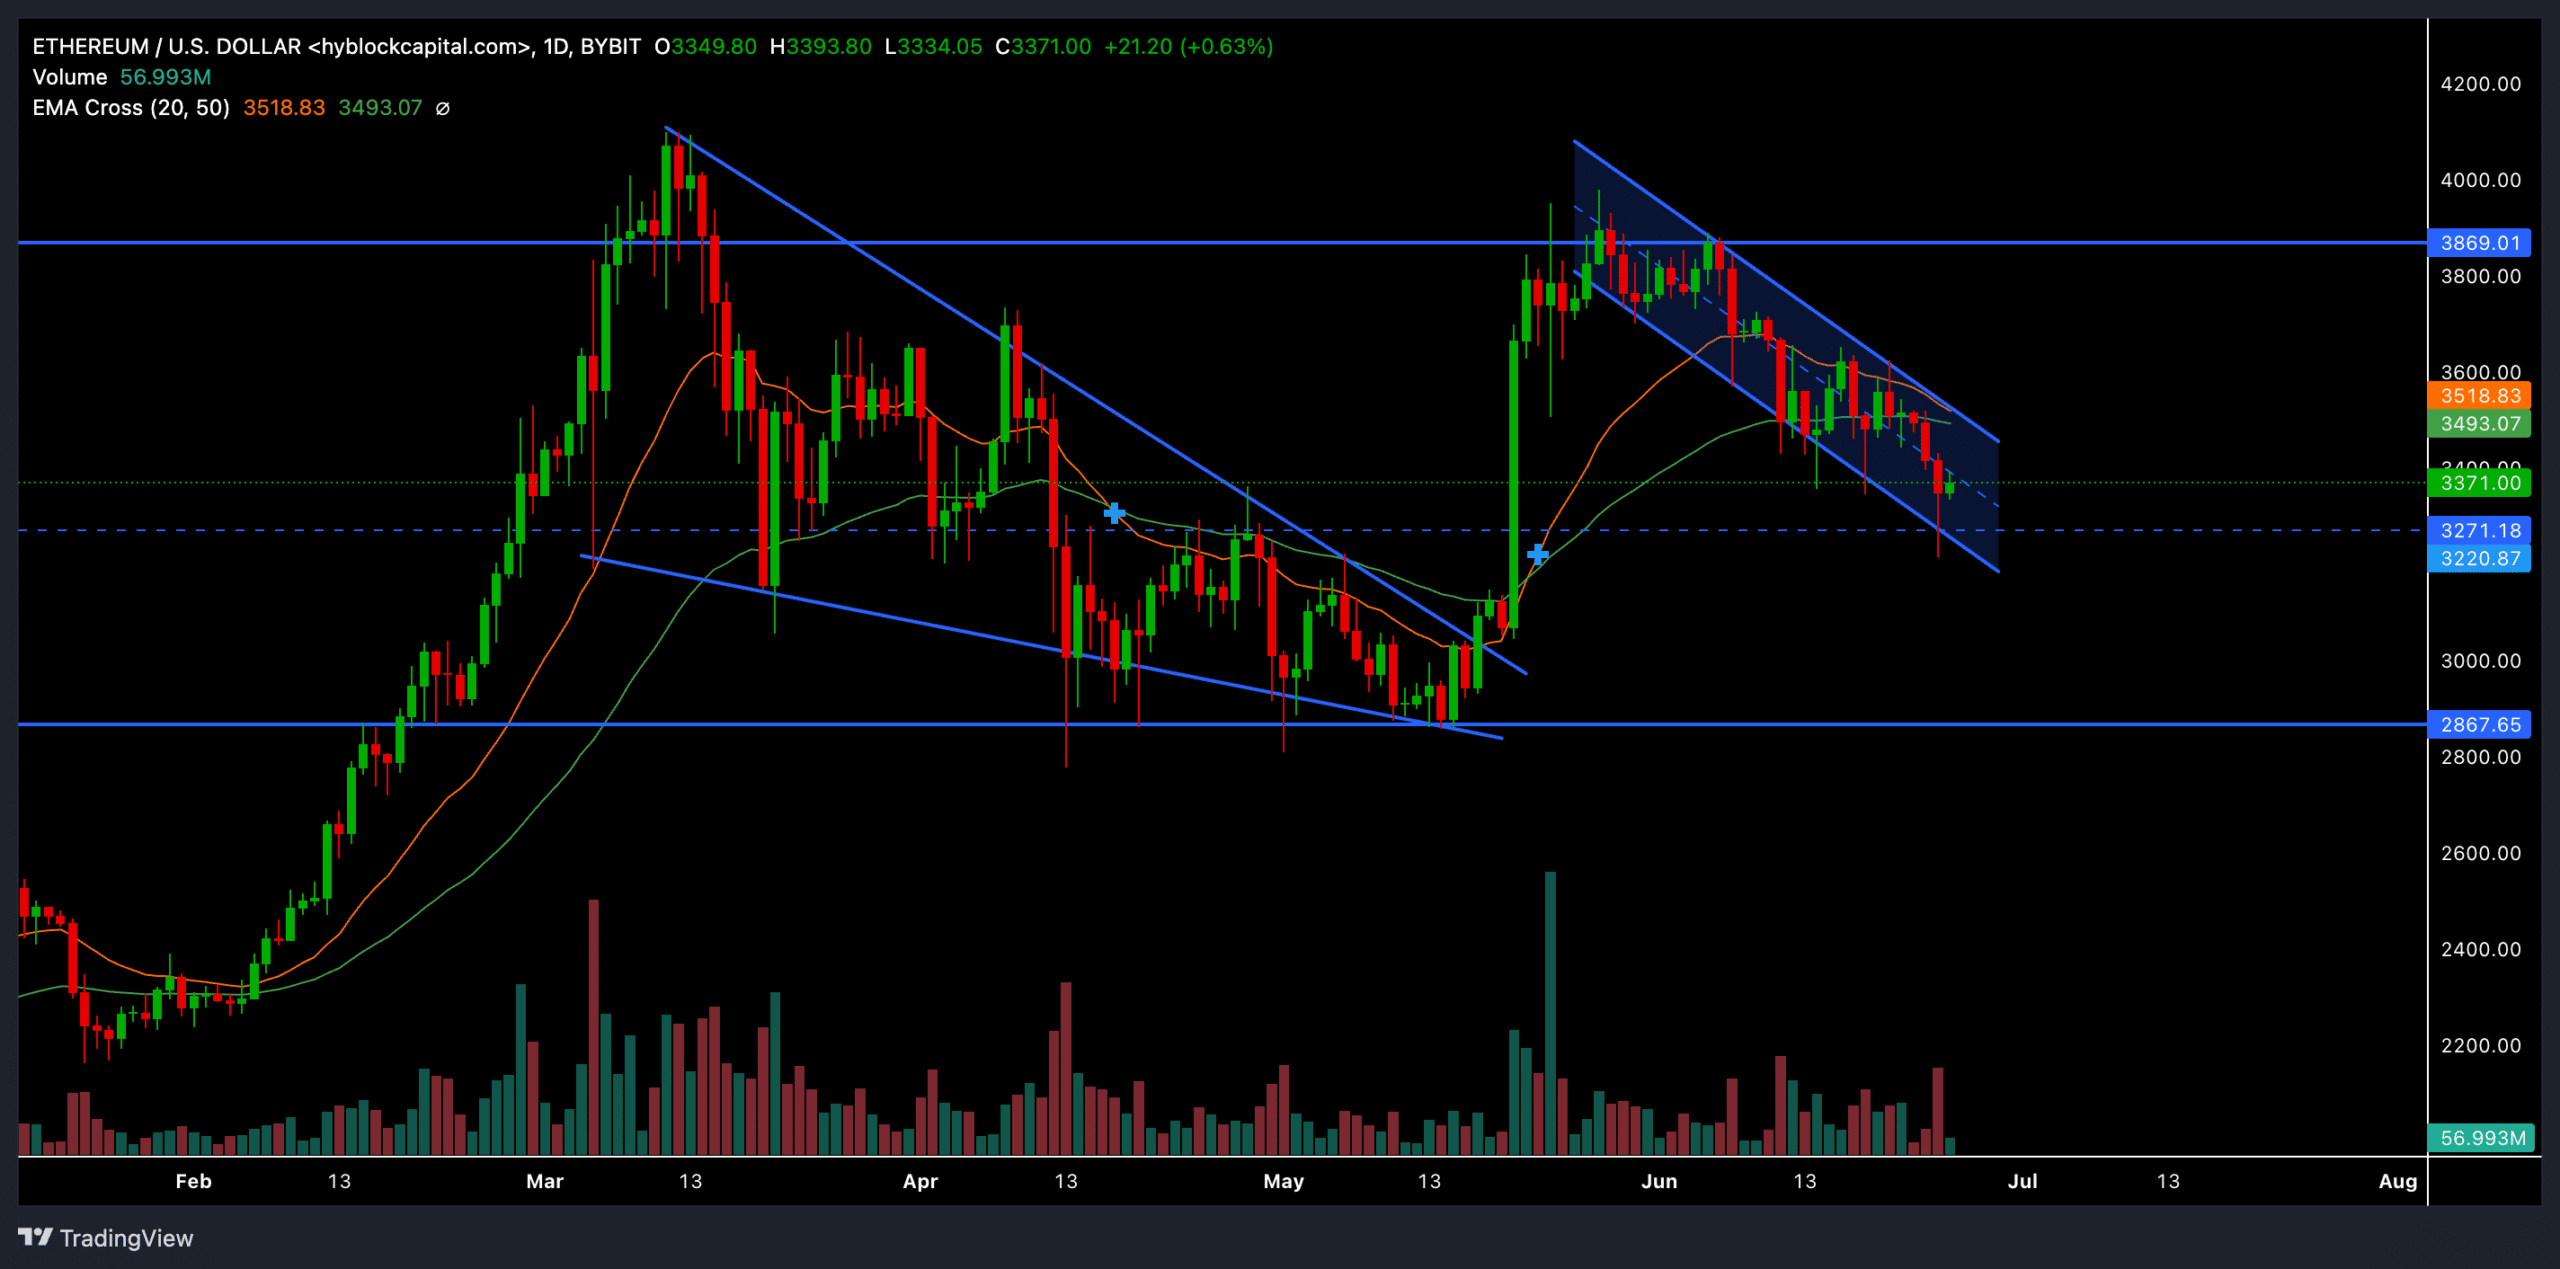
  • Ethereum chalked out a classic descending channel pattern on the daily chart, confirming a bearish edge.
  • The immediate support range at the $3,200 level can determine ETH’s near-term trajectory.

Ethereum’s [ETH] reversal from the $3,900 resistance level over the past month has set the stage for the bears.

The altcoin’s increasing Open Interest trend during this time has further raised questions about its ability to hold the immediate support level.

Should the sellers continue to increase pressure from its press time level, ETH could invalidate a bullish rally and see a downward breakout. A rebound from the $3,260 level can help the buyers regain some momentum.

At the time of writing, ETH was trading at $3,362, up by nearly 3% in the past 24 hours.

Can ETH bulls reverse the bearish trend?
Ethereum/USD chart

Source: Hyblockcapital, ETH/USD

ETH sellers have consistently held the resistance level near the $4,000 mark as the altcoins for over three months. The $3,900 ceiling blocked ETH’s 35% rally last month and pulled the price below the 20-day and 50-day EMAs.

The resulting price action chalked out a classic descending channel pattern on ETH’s daily chart.

Should the upper trendline of this descending channel continue to resist bull runs, ETH could continue its downtrend in the short term. In this case, the $2,800 region could help provoke a bullish rebound.

On the other hand, a potential close above the current pattern can set the stage for bulls to trigger a rally. In such a case, The first significant resistance level for the buyers would be in the $3,900 region.

See also  ETH bulls suffer a setback after reaching $1750, can they recover?

The Stochastic RSI showed extremely oversold readings at the time of writing. Buyers should wait for a potential bullish crossover to gauge ETH’s near-term bullish potential.

Price action rising above the 20/50 EMA and a bullish crossover on stochastic RSI together could create a strong buy signal for traders.

Ethereum: Bearish edge emerges
Source: Hyblockcapital, ETH/USD

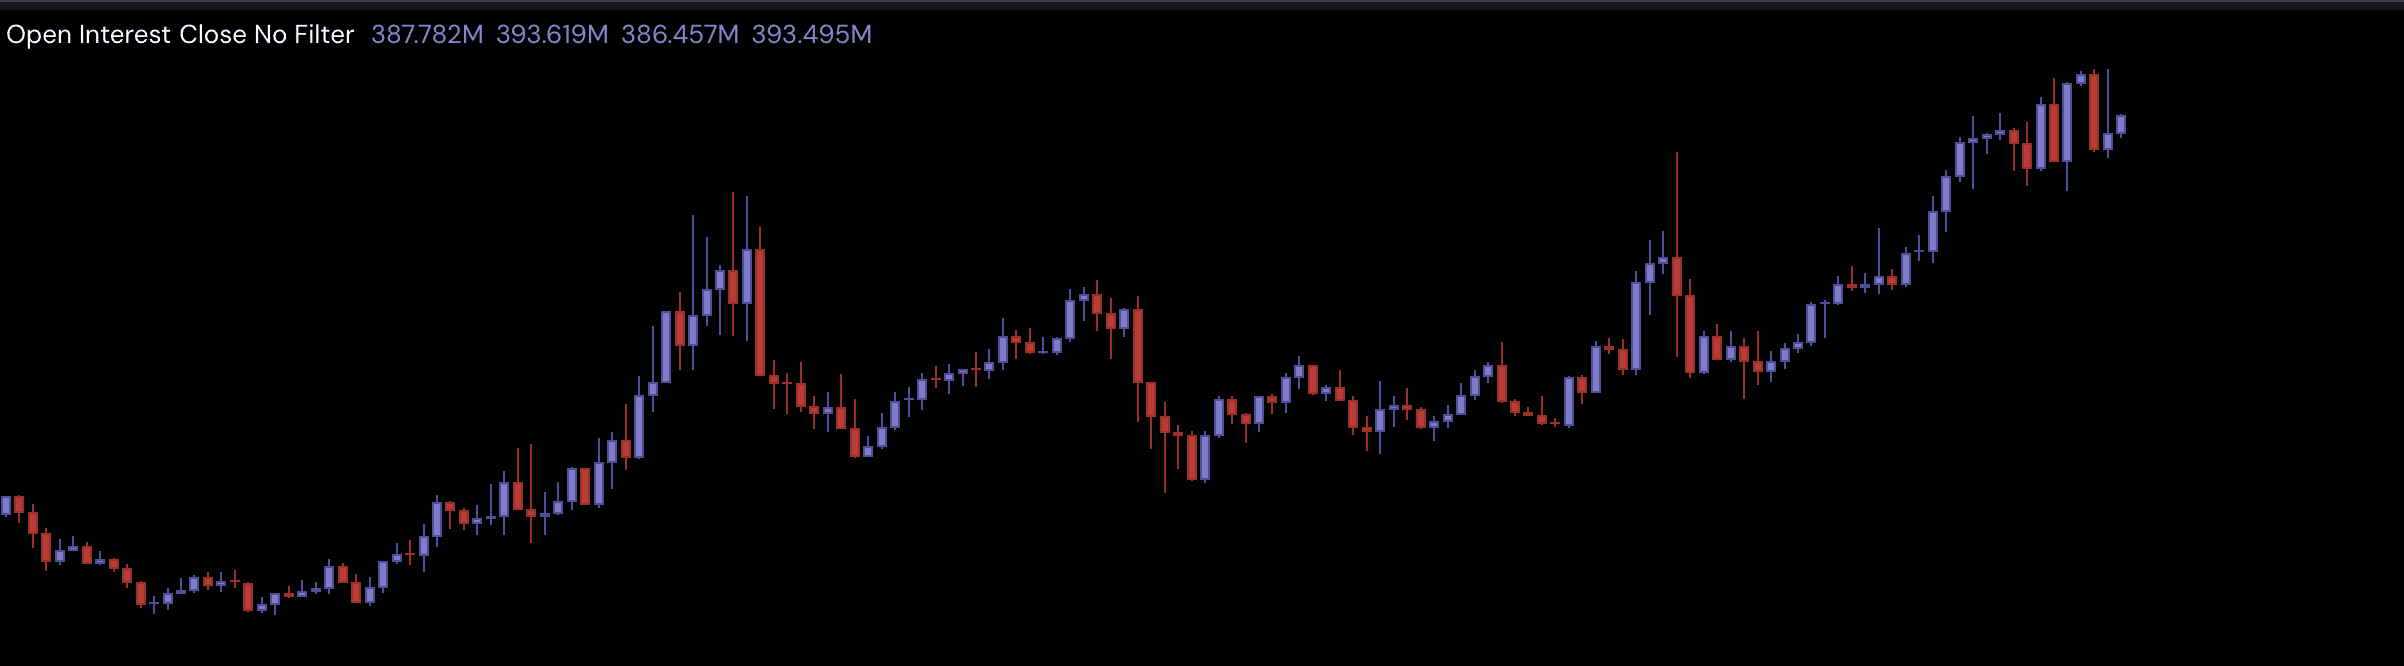
According to data from Hyperblockcapital, ETH’s Open Interest indicator marked an uptrend (higher highs) over the past month.


Is your portfolio green? Check out the ETH Profit Calculator


However, the price action saw lower highs during this time. This reading typically suggests a bearish divergence– where more traders are entering short positions rather than long positions.

Also, the total net exchange flows over the past day increased by nearly 140% to reaffirm the overall bearish sentiment. ETH’s rebound from the $3.2K–$3.3K support range would be crucial to break the bearish narrative.

Next: Bitcoin to crash? Analysts predict steep decline to $50K

Source link

Ethereums Level MakeOrBreak point Price rally
Share. Facebook Twitter Pinterest LinkedIn Tumblr Email

Related Posts

What Is Bitcoin Halving & How Does It Affect BTC Price?

September 1, 2026

Is Crypto Mining Profitable in 2026? Costs, Returns, and the Real Break-Even Point

August 20, 2026

Blockspace Futures: How Ethereum’s Most Valuable Commodity is Being Financialized in 2026

May 25, 2026

The Human Patch: How Ethereum’s Clear Signing Standard Is Tackling Crypto’s Most Exploited Vulnerability

May 14, 2026
Add A Comment

Leave A Reply Cancel Reply

Top Posts

Is Staking Crypto Safe? What You Should Know Before Staking

September 15, 2026

What Is the CLARITY Act and What Does It Mean for Crypto?

September 14, 2026

What Is Cross Margin in Crypto? How It Works, Risks, and Examples

September 14, 2026

Subscribe to Updates

Get the latest news and Update from VIP Crypto Signals about Crypto, Web3, Metaverse, NFT and more.

Our mission is to develop a community of people who try to make financially sound decisions. The website strives to educate individuals in making wise choices about Cryptocurrencies, NFT, Metaverse and more.

We're social. Connect with us:

Facebook Twitter Instagram Pinterest YouTube
Top Insights

Is Staking Crypto Safe? What You Should Know Before Staking

September 15, 2026

What Is the CLARITY Act and What Does It Mean for Crypto?

September 14, 2026

What Is Cross Margin in Crypto? How It Works, Risks, and Examples

September 14, 2026
Get Informed

Subscribe to Updates

Get the latest news and Update from VIP Crypto Signals about Crypto, Web3, Metaverse, NFT and more.

Facebook Twitter Instagram Pinterest
  • Contact
  • Disclosure
  • Privacy Policy
  • Terms & conditions
© 2026 Vip Crypto Signals - All rights reserved.

Type above and press Enter to search. Press Esc to cancel.

  • FibSwap DEXFibSwap DEX(FIBO)$0.0084659.90%
  • bitcoinBitcoin(BTC)$70,953.006.13%
  • ethereumEthereum(ETH)$3,664.5818.50%
  • tetherTether(USDT)$1.00-0.01%
  • binancecoinBNB(BNB)$627.698.99%
  • solanaSolana(SOL)$181.131.69%
  • staked-etherLido Staked Ether(STETH)$3,662.5418.48%
  • usd-coinUSDC(USDC)$1.00-0.02%
  • rippleXRP(XRP)$0.545.05%
  • dogecoinDogecoin(DOGE)$0.1634778.14%

