
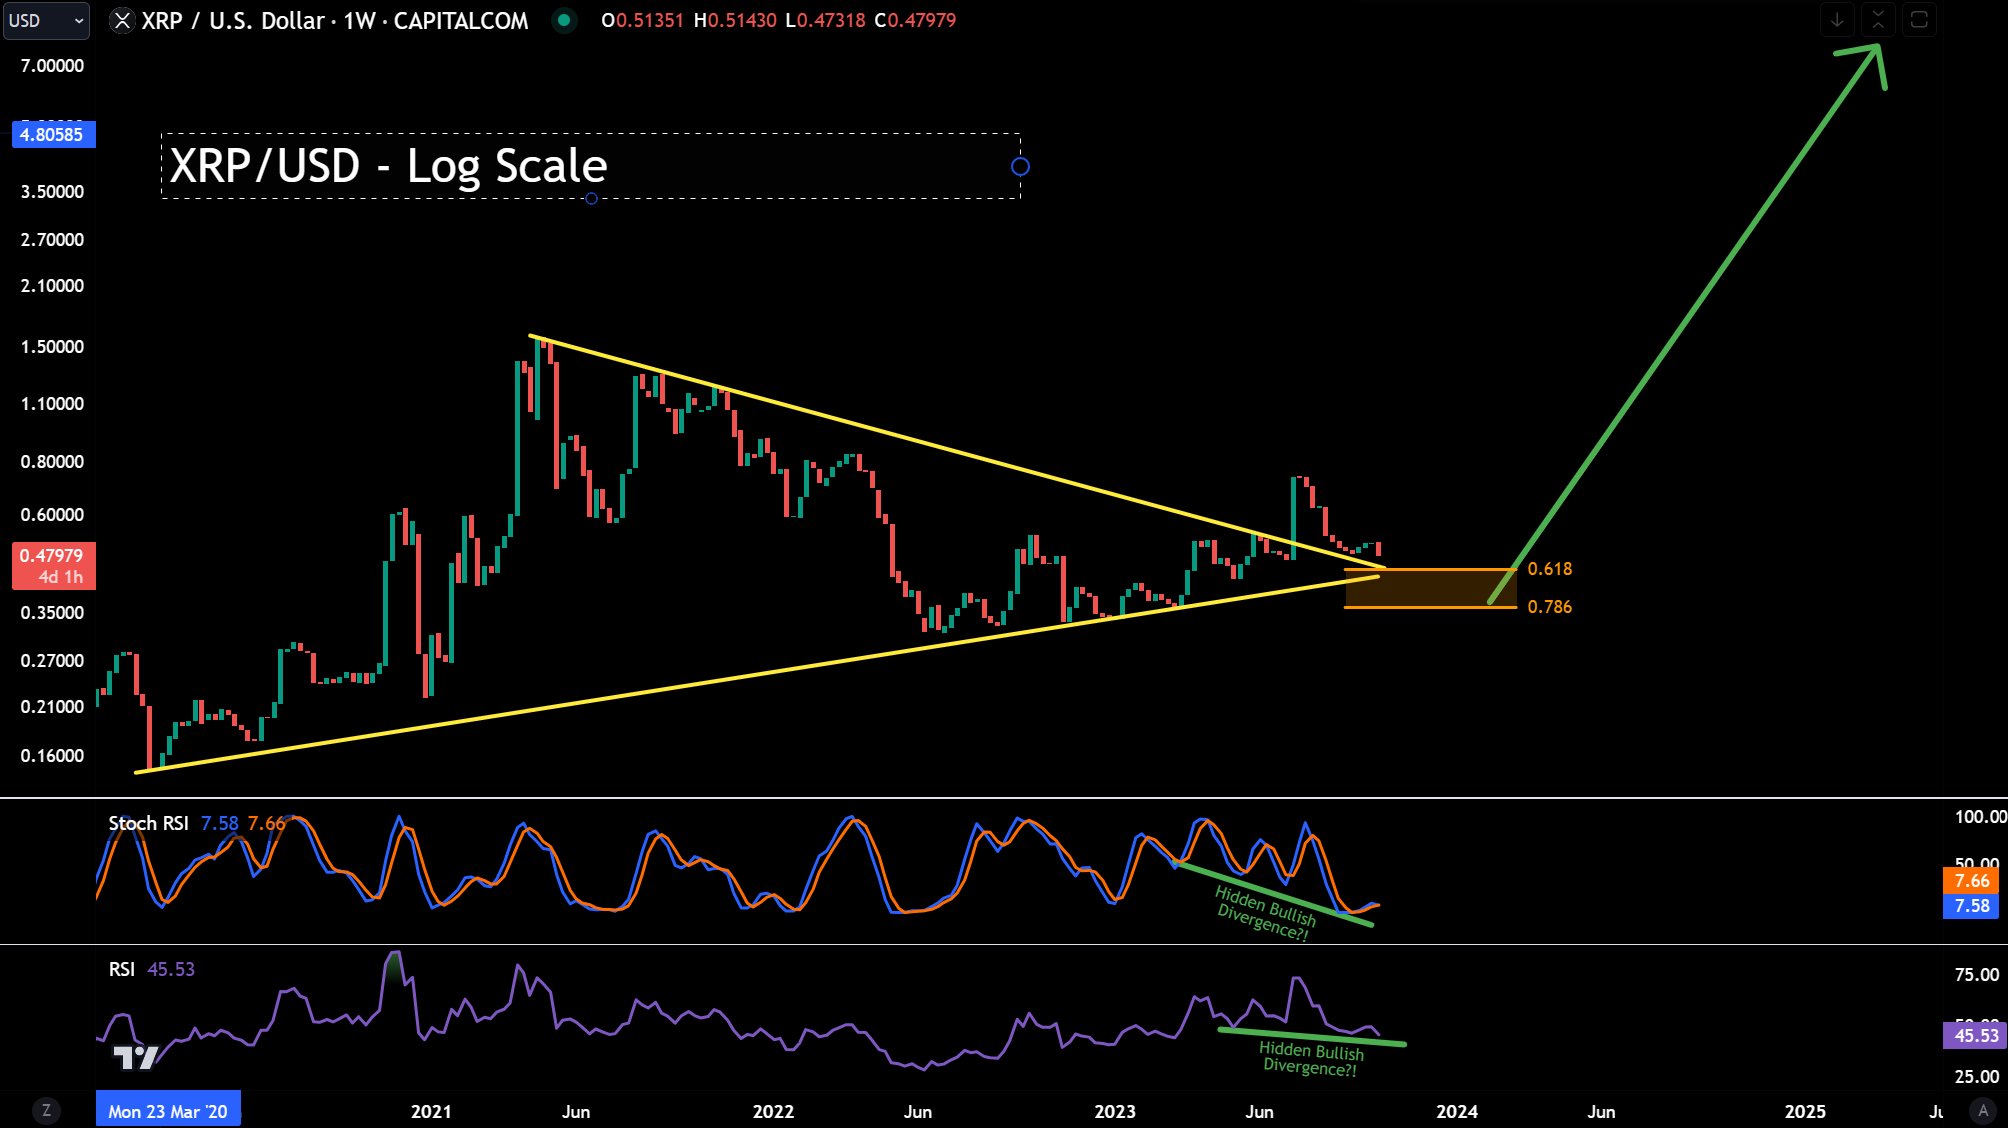
A meticulous analysis of the XRP/USD trading pair by renowned crypto analyst, Jaydee, has shed light on some compelling technical patterns and indicators. With the crypto community eagerly anticipating XRP’s next major move, Jaydee offers insights that hint at two critical price thresholds before a potential rally toward $5.
What’s Next For The XRP Price?
The analyst today shared the following 1-week chart of XRP and explained: “XRP – PATIENCE & ignoring the news is key! Let’s take a step back and look at a more macro view! Though short term may look scary (even w/all these irrelevant news), the weekly chart still creating ‘hidden bullish divergence’ on RSI/SRSI.”
Central to Jaydee’s analysis of the logarithmic scale chart of XRP/USD is the identification of a symmetrical triangle pattern. This pattern on a chart signifies a phase of consolidation, after which the price will either break out or break down. A breach of the lower trendline signals the onset of a fresh bearish trend, whereas a surge past the upper trendline suggests the commencement of a new bullish trend.
Jaydee highlights the significance of the $0.4797 support level within this pattern for the XRP price. The chart suggests robust support at this price level which aligns with the 61.8% Fibonacci retracement level.
The analyst also brings attention to the 78.6% Fibonacci retracement level which he sees as the lower end of the dip area. The chart implies that XRP could further drop significantly towards this area below $0.35. In the event of such a short-term pullback, this lower Fibonacci level could very well delineate a critical support area.
As remarked by Jaydee in the tweet, the Relative Strength Index (RSI) and the Stoch RSI have both formed hidden bullish divergences. The RSI of XRP/USD in the 1-week chart currently stands around 45.53, and is in neutral territory, not signaling any immediate overbought or oversold conditions. Yet, the divergence in the RSI presents a captivating narrative.
Jaydee highlights the hidden bullish divergence, where the price charts higher lows while the RSI is trending with lower lows, typically an indication of diminishing bearish momentum. This is usually seen as a bullish sign as it suggests that the downward momentum is weakening and could well be a precursor to a bullish phase. The Stochastic RSI stands at 7.66 and shows the same pattern. Overall, Jaydee’s forecast for XRP is bullish in the medium to long term.
In conclusion, the convergence of these technical indicators and the unwavering support at $0.4797 shows strong bullish undercurrents for the XRP price. Still, it is conceivable that XRP might face a further short-lived drawdown before launching into a significant bullish ascent. Assuming these patterns persist, a leap to a $5 pricing (green arrow) seems plausible as per Jaydee.
Feedback From The XRP Community
Delving into the commentary, Jaydee added nuances, stating, “Scary on the daily chart (glad we knew that 12% correction was coming). The weekly chart is way different compared to daily.”
When queried by a user named Steven about the potential implications of Bitcoin ETF approvals and increased adoption and utility, Jaydee responded, “Charts will still play out. May even have a ‘wick’ at higher levels on higher time frames. But the body candle close on the macro view is the true value, rather than any wicks. Wicks would just be “noise” caused by news. Didn’t all these bullish news REKT many already?”
On the timing of the $5 forecast, Jaydee candidly remarked, “Nobody can predict timeframe or knows when we would start getting the next impulse move up. I just placed an arrow wherever. Wait a minute… You really think we are God?”
Responding to a user’s inquiry about XRP potentially dipping to $0.35 creating a lower low, Jaydee clarified, “It would if a body candle closes there. But possible wicks can head down there.”
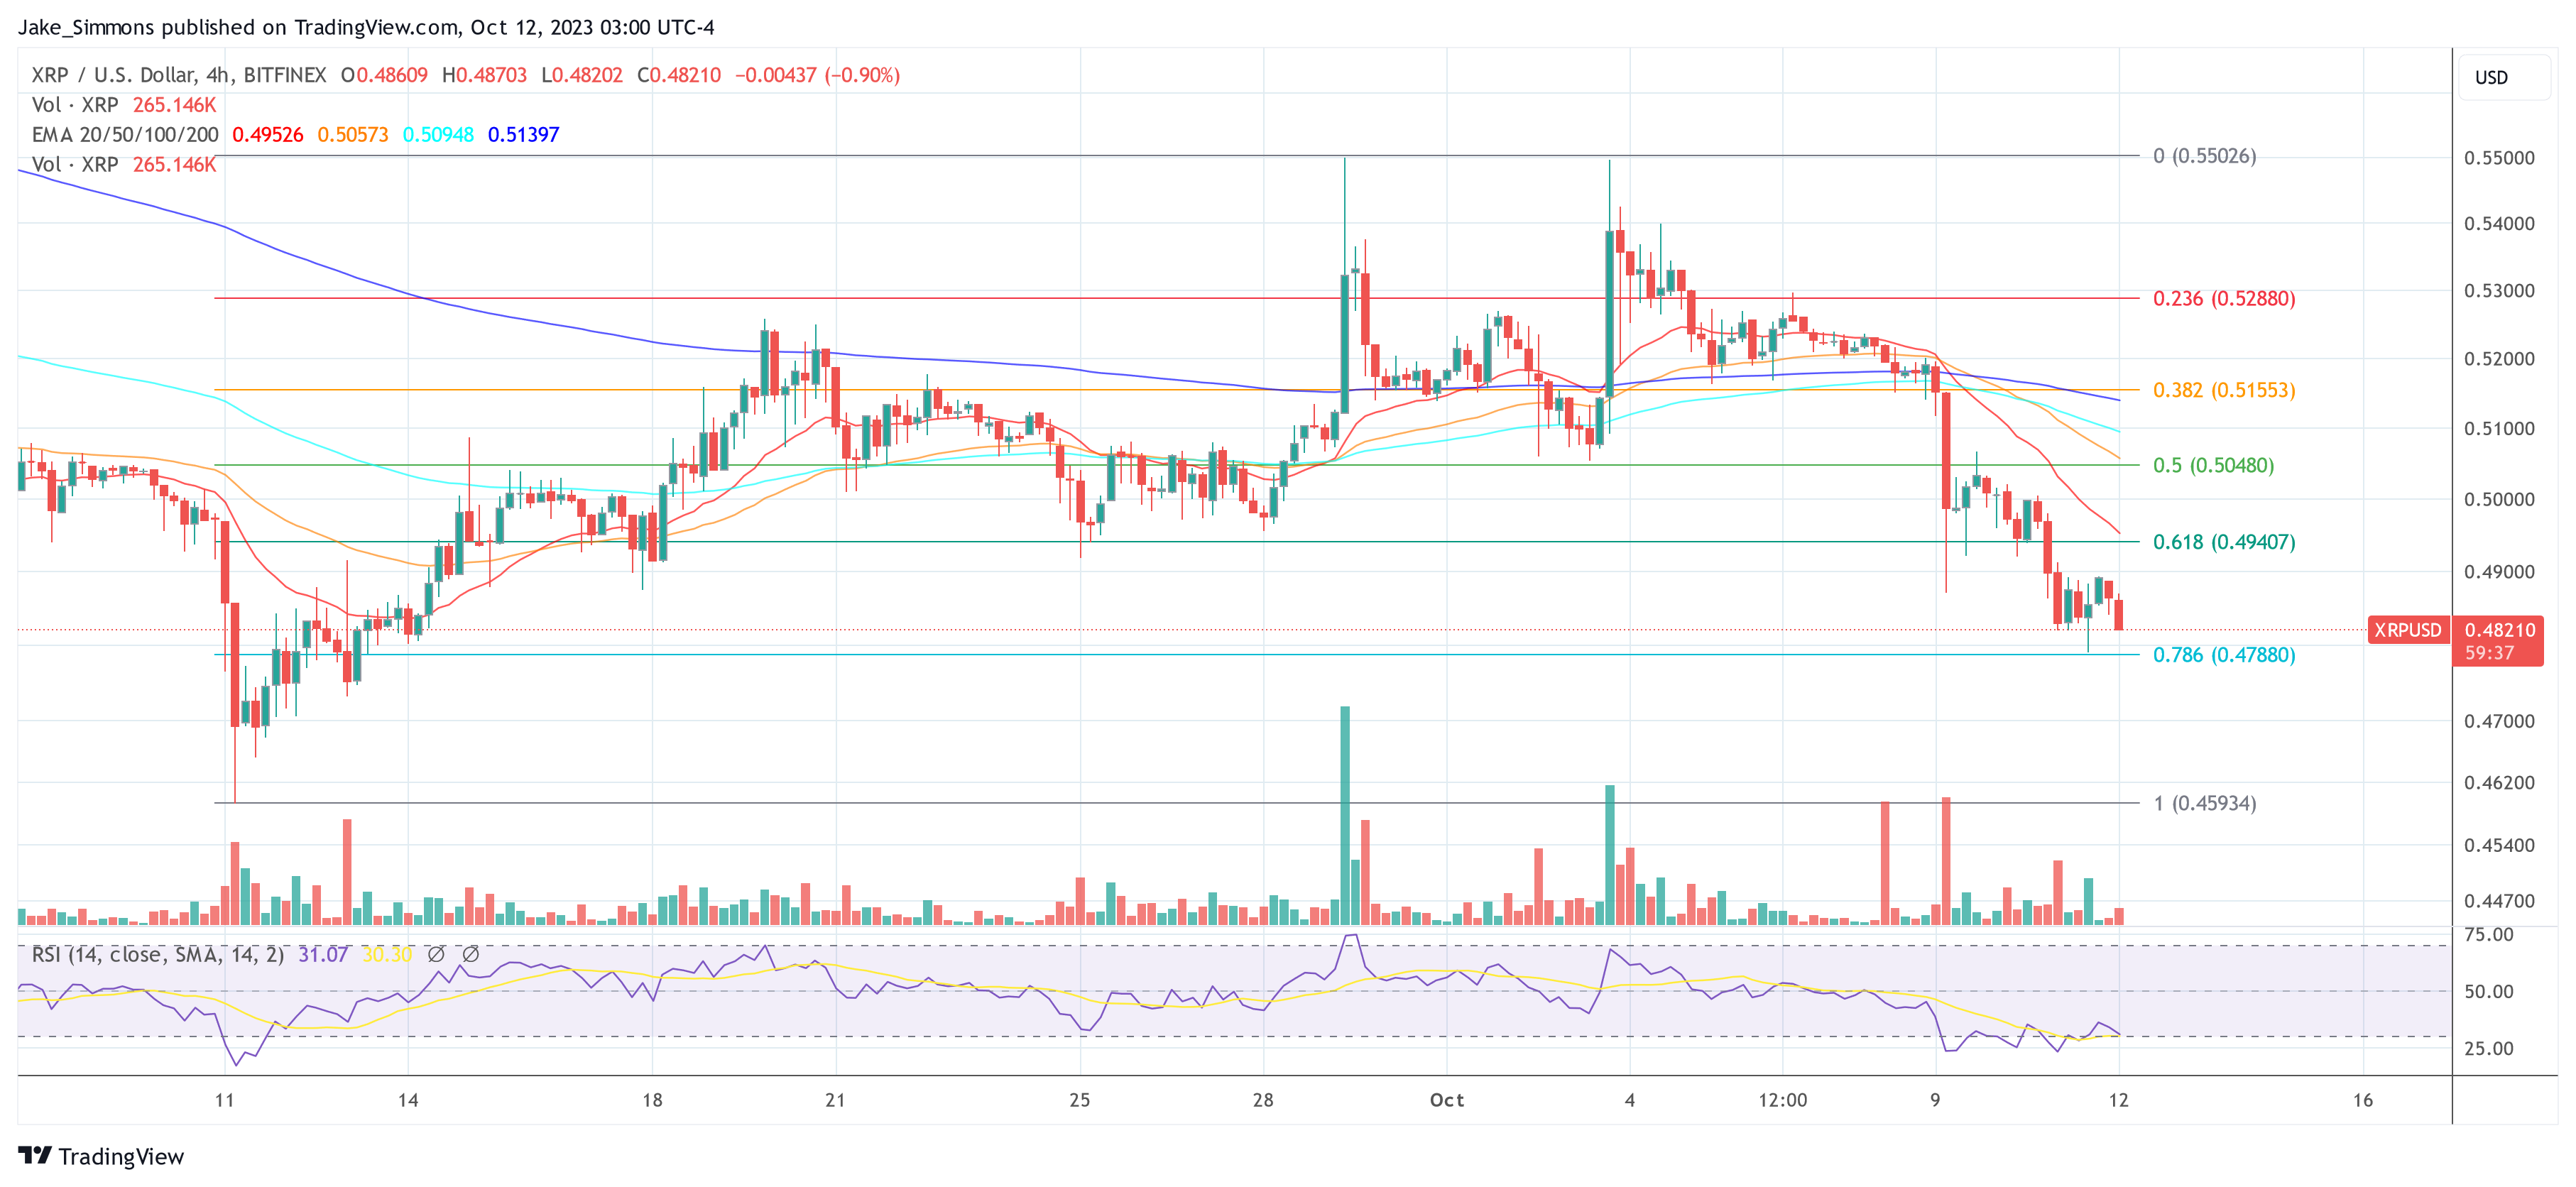
At press time, XRP traded at $0.4821.
Featured image from Shutterstock, chart from TradingView.com







