
- The past 24 hours have seen a decline in the general cryptocurrency market.
- BTC, ETH, and XRP prices may witness further decline in the short term.
As the crypto market overheats, the values of many leading assets have declined over the past 24 hours. Due to this, the global cryptocurrency market capitalization plummeted by 7% during the same period, according to Coingecko’s data.
At the time of writing, the global cryptocurrency market cap was $2.7 trillion.
Long liquidations in the Bitcoin market
Leading coin Bitcoin [BTC] has seen its price decline by almost 10% in the past 24 hours. During Asian trading hours of 15th March, the price of the coin dropped to a low of $67,000, marking a 7% decline, before a brief rebound to $68,500.
According to CoinMarketCap’s data, the number one coin exchanged hands at $67,742 as of this writing, registering an 8% price decline in the past 24 hours.
However, during the same period, the coin’s trading volume rallied by 55%, thereby creating a bearish price/volume divergence. This indicated a heightened selling pressure amid the high market activity.
This divergence between an asset’s price and its trading volume is common when many investors sell off their holdings, potentially due to negative sentiment or concerns about future price movements.
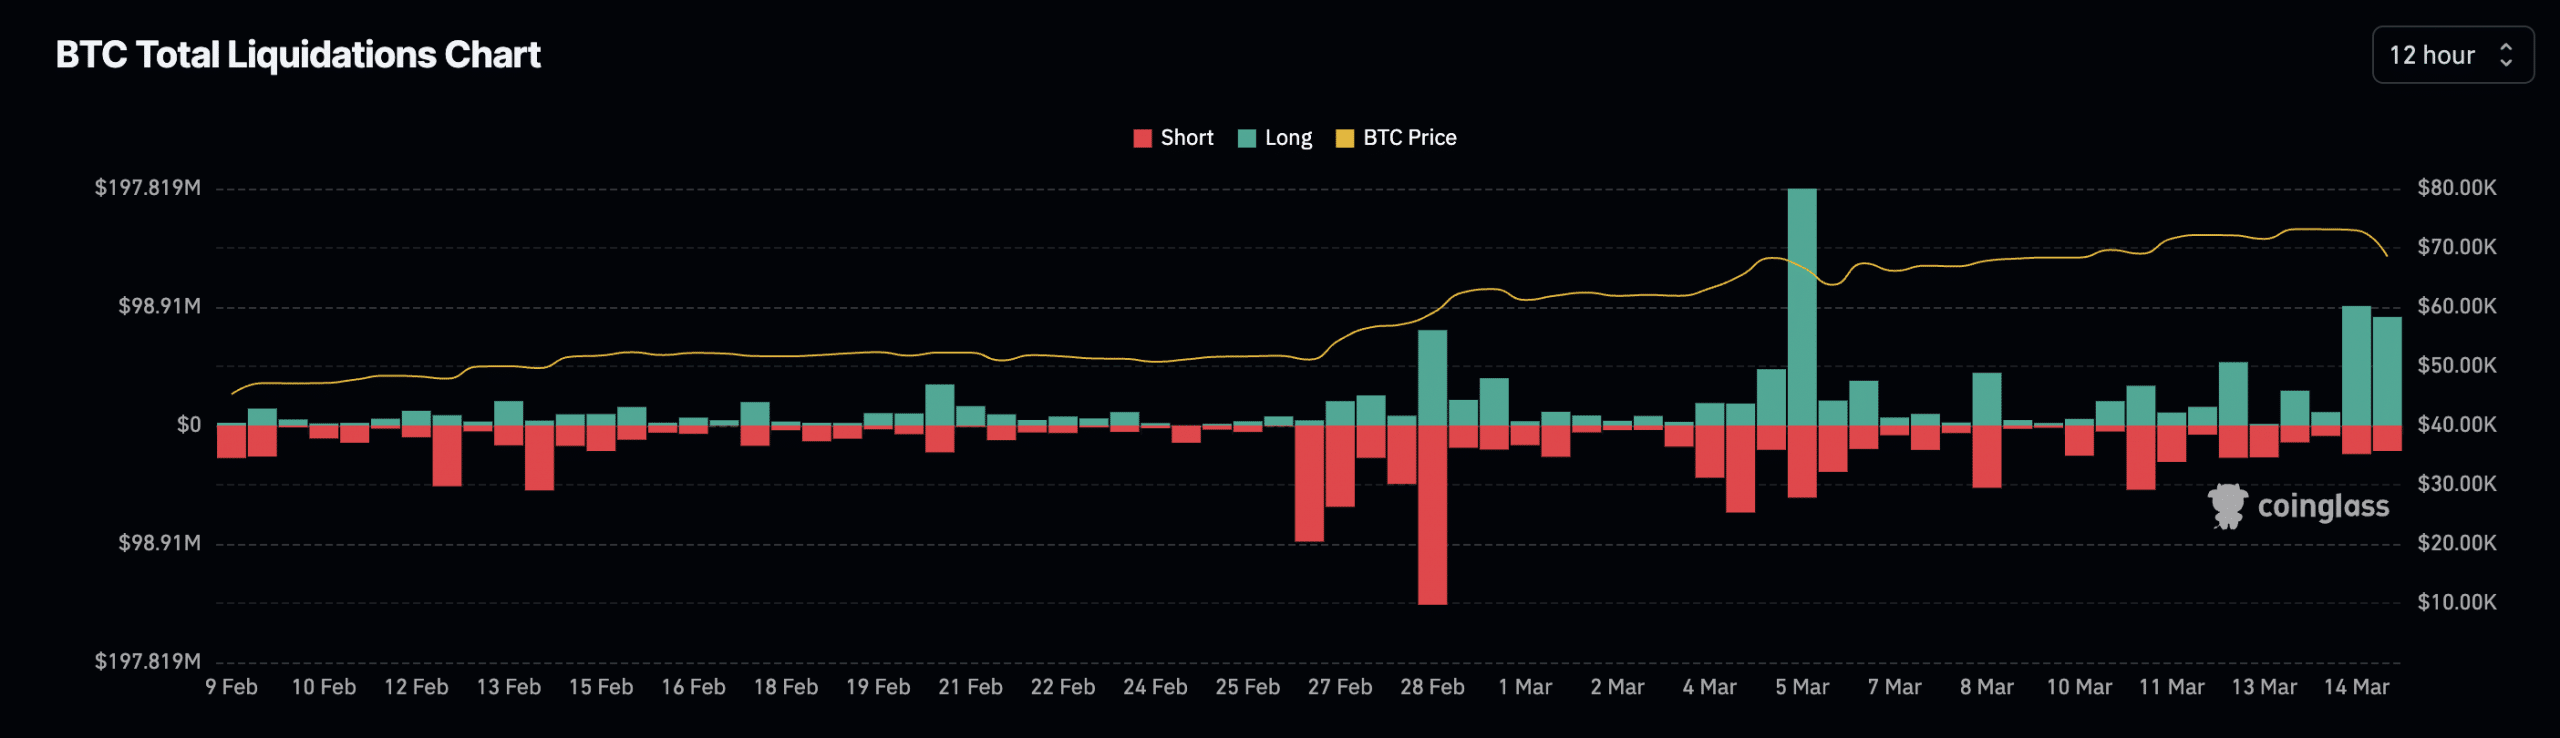
Due to the sharp fall in Bitcoin’s price, long liquidations in the coin’s futures market surged. According to Coinglass’ data, over $90 million in long positions have been erased over the last 12 hours.
Source: Coinglass
A position is deemed to have been liquidated when it is forcefully closed due to insufficient funds to maintain it. Long liquidations occur when the value of an asset suddenly drops, and traders who have open positions in favor of a price rally are forced to exit their positions.
However, despite this decline, the coin’s futures open interest continued to climb. In the last 24 hours, this increased by 2%. Per Coinglass data, BTC’s futures open interest was $37.25 billion at press time.
Likewise, its funding rates observed across crypto exchanges remained positive. The rise in open interest and the positive funding rates showed that despite the current price decline, investors have chosen to remain steadfast in their conviction that Bitcoin’s price would still initiate a rally.
The bears are looking to regain control of the Ethereum market
Due to its statistically positive correlation with Bitcoin, Ethereum [ETH] has also suffered a decline in its value in the last 24 hours. Exchanging hands at $3,708 at press time, the coin’s price has dropped by 7% during that period.
An assessment of ETH’s price performance on a daily chart showed a steady uptick in coin sell-offs.
For example, readings from the coin’s Moving Average Convergence Divergence (MACD) indicator showed that its signal line (orange) successfully crossed above the MACD line (blue) on 14th March.
When an asset’s signal line intersects its MACD line in an uptrend, it’s typically considered a bearish signal. This is because the signal line is a 9-day Exponential Moving Average (EMA) of the MACD line itself. It acts as a trigger for buy and sell signals. When it crosses above the MACD line, it suggests a potential shift towards a bearish trend.
Typically, traders interpret this bearish crossover as a signal to sell or a warning sign of a potential downturn in the market.
Further, suggesting the decline in demand for ETH amongst spot market participants, its Relative Strength Index (RSI) was in a downtrend. Although it remained above the center line at press time, its position indicated a decline in ETH accumulation.
Confirming the steady fall in ETH demand, its on-balance volume (OBV), which measures the coin’s buying and selling pressure, was down by 0.3% in the past 24 hours. When an asset’s OBV line falls, it indicates that the selling volume is increasing, suggesting downward price movement.
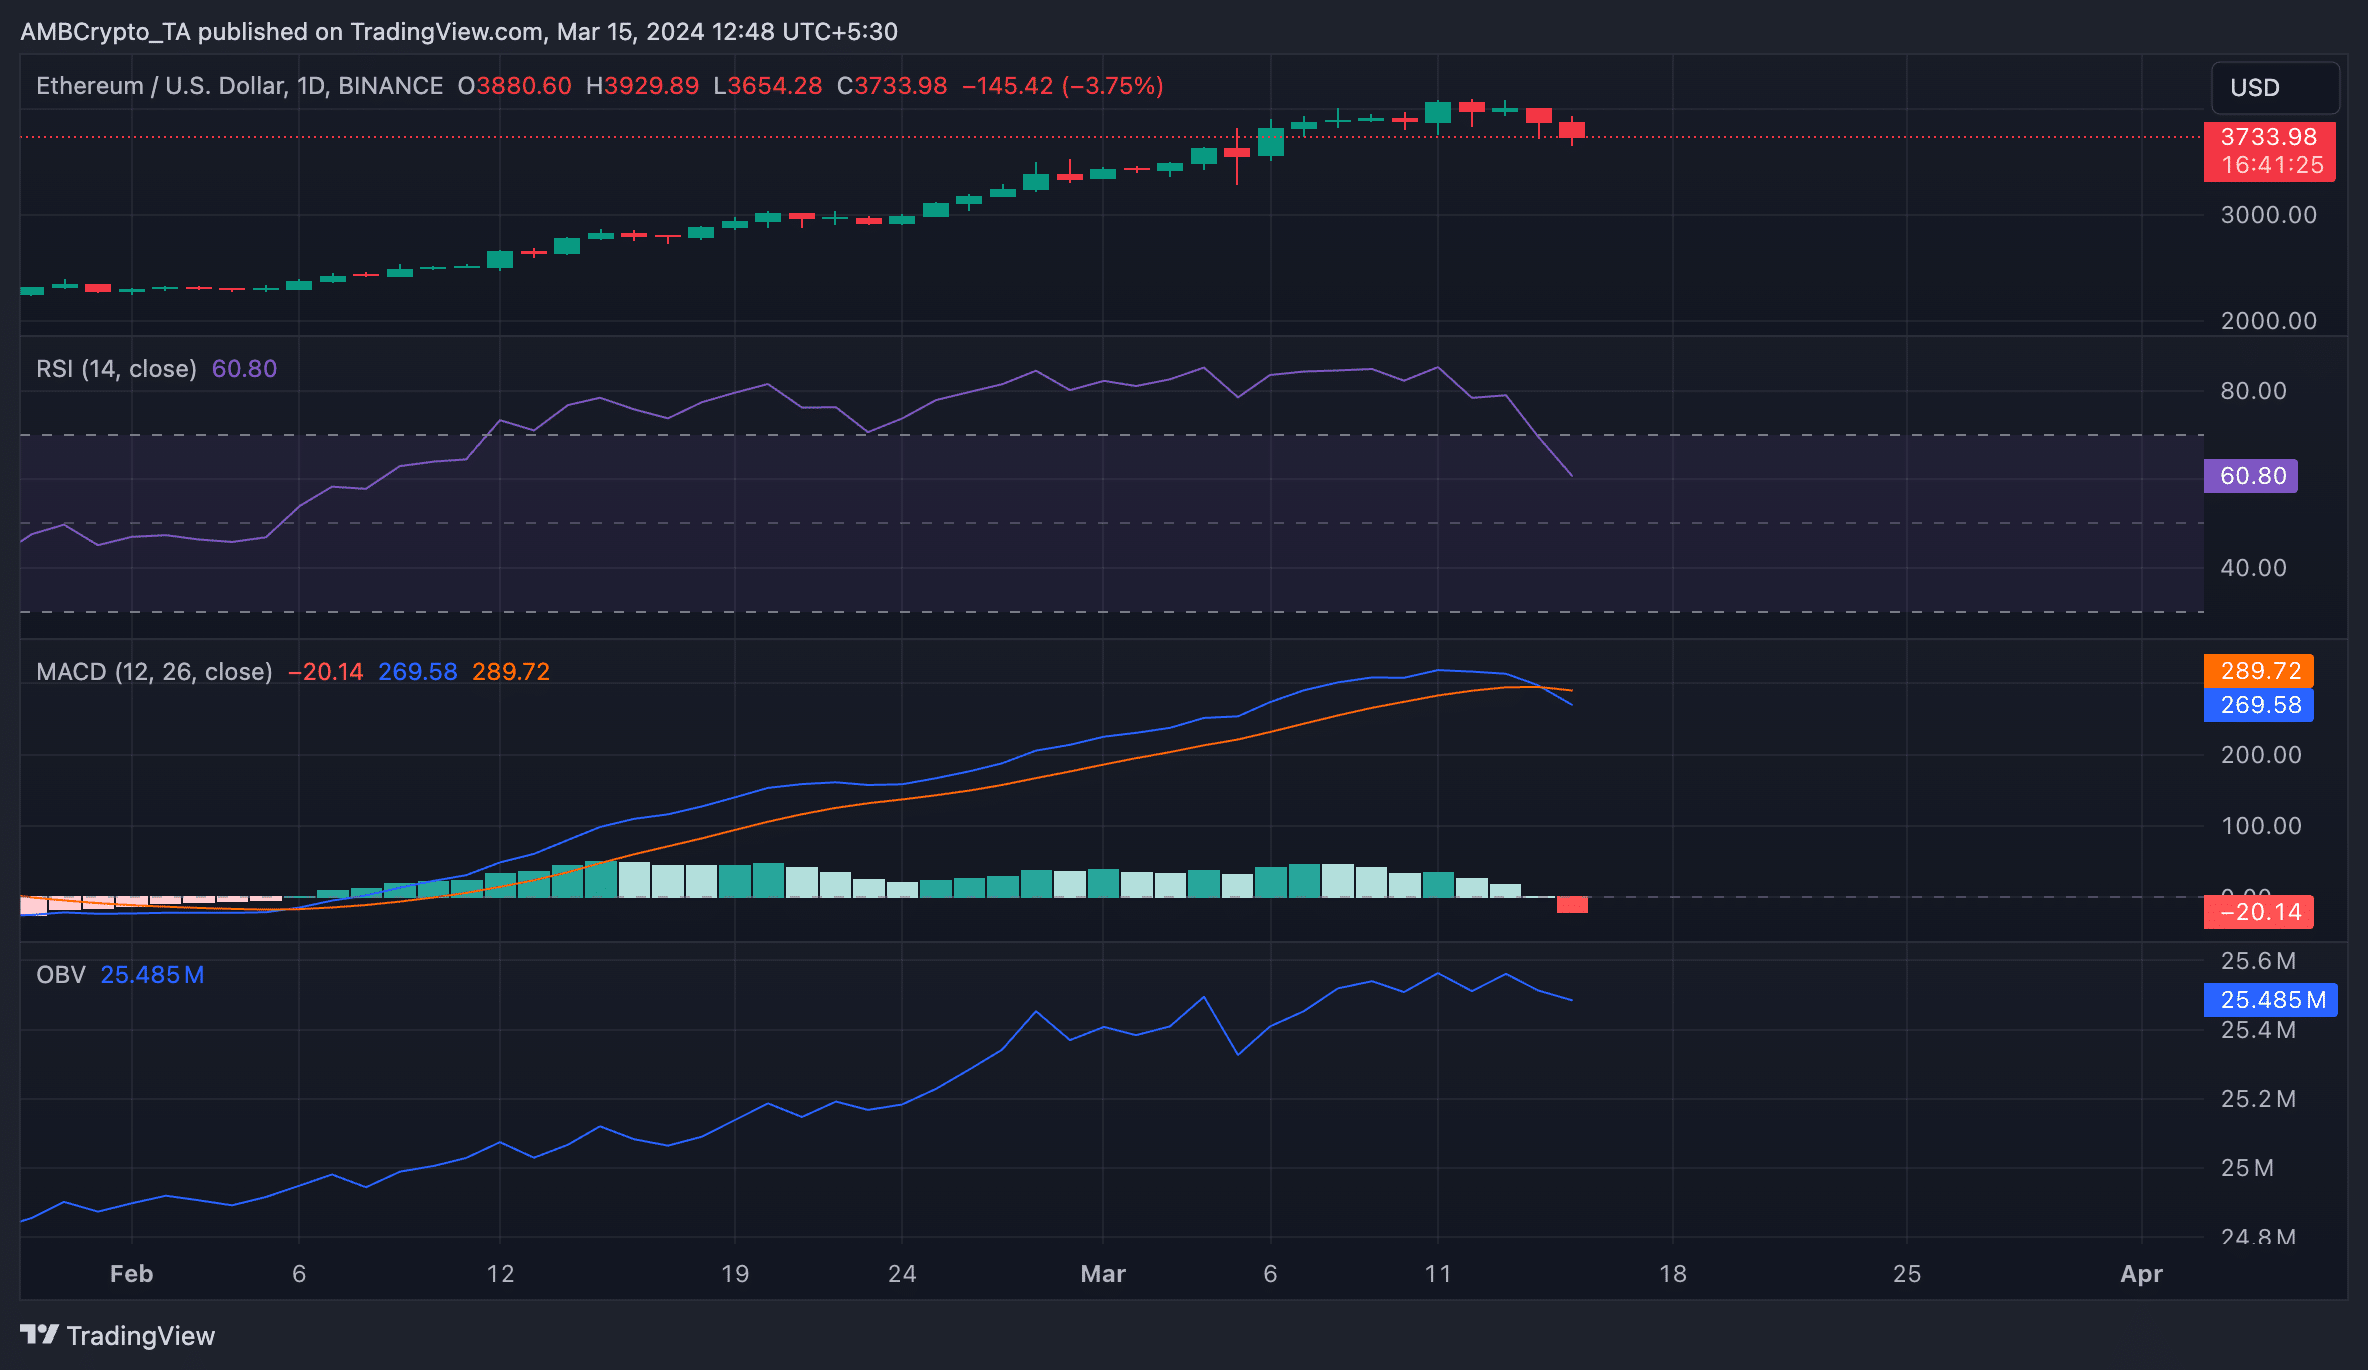
Source: ETH/USDT on TradingView
An assessment of ETH’s exchange activity in the past 24 hours confirmed the increase in profit-taking activity. According to CryptoQuant’s data, the coin’s exchange reserve was up by 1% during that period.
As of this writing, 14 million ETH worth around $52 billion were held across cryptocurrency exchanges.
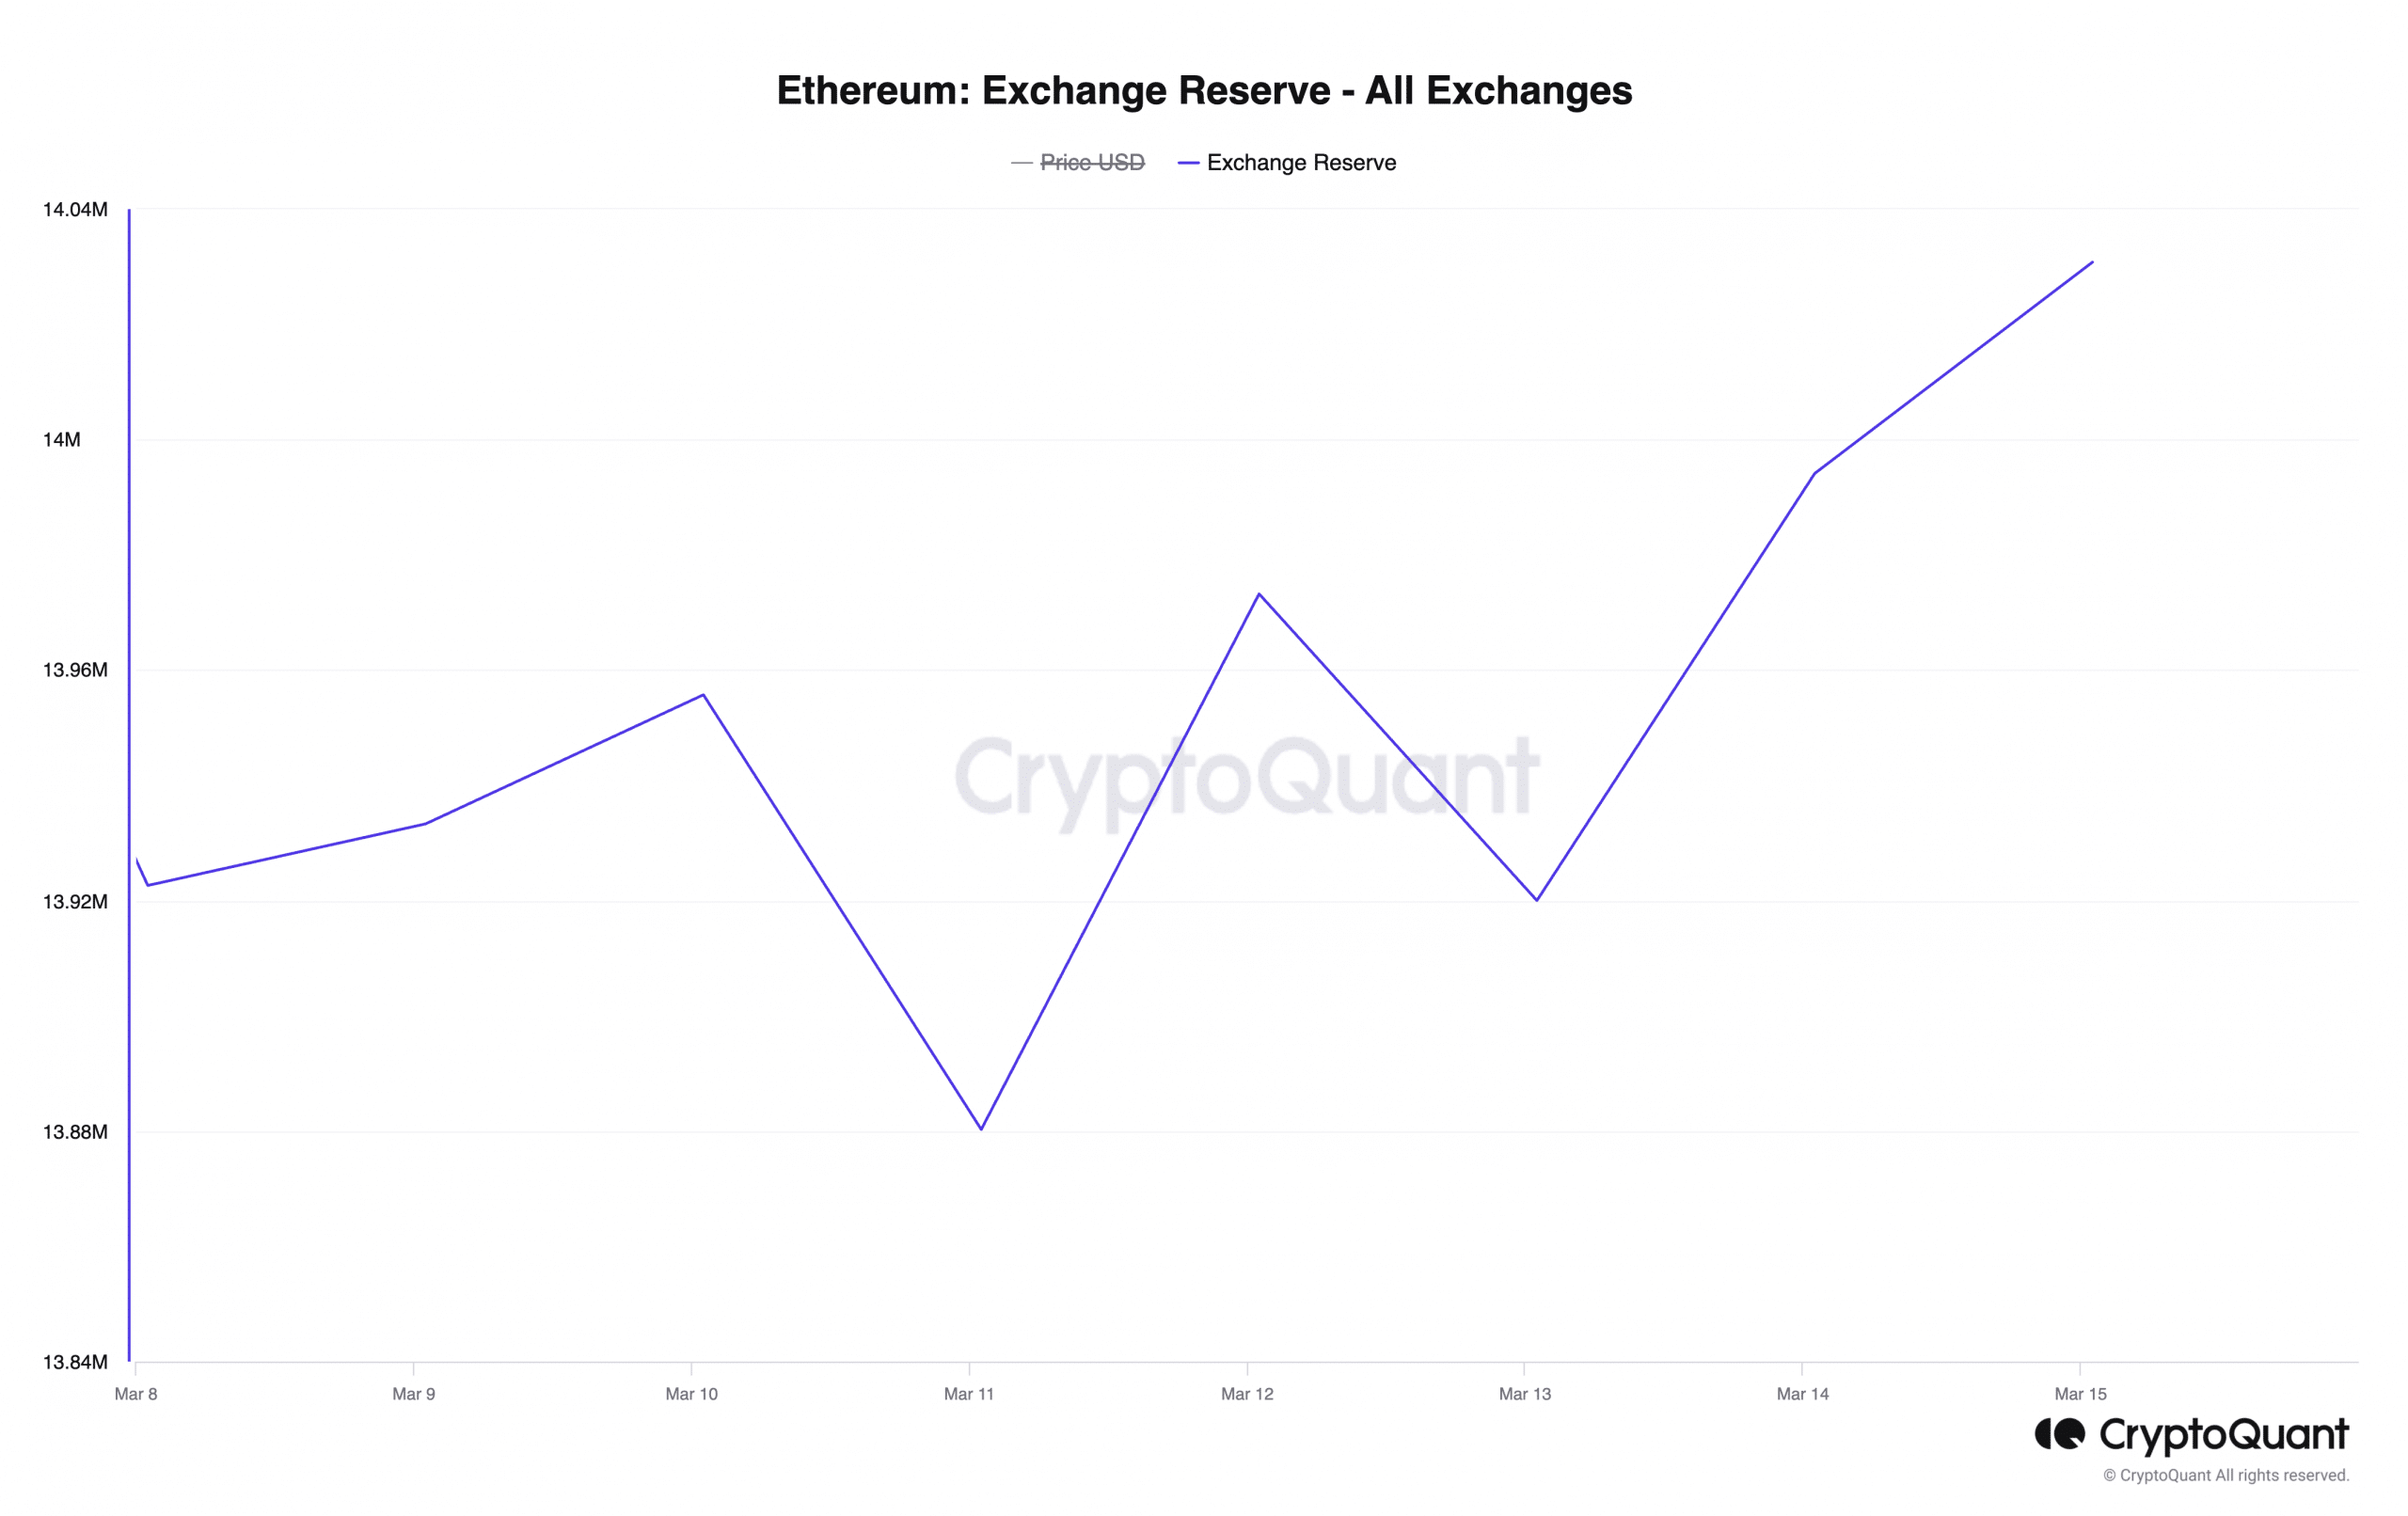
Source: CryptoQuant
XRP hints at further downside
Ripple’s XRP saw its value drop by 6% in the past 24 hours. Per CoinMarketCap data, the sixth largest crypto asset by market capitalization exchanged hands at $0.63 at the time of writing.
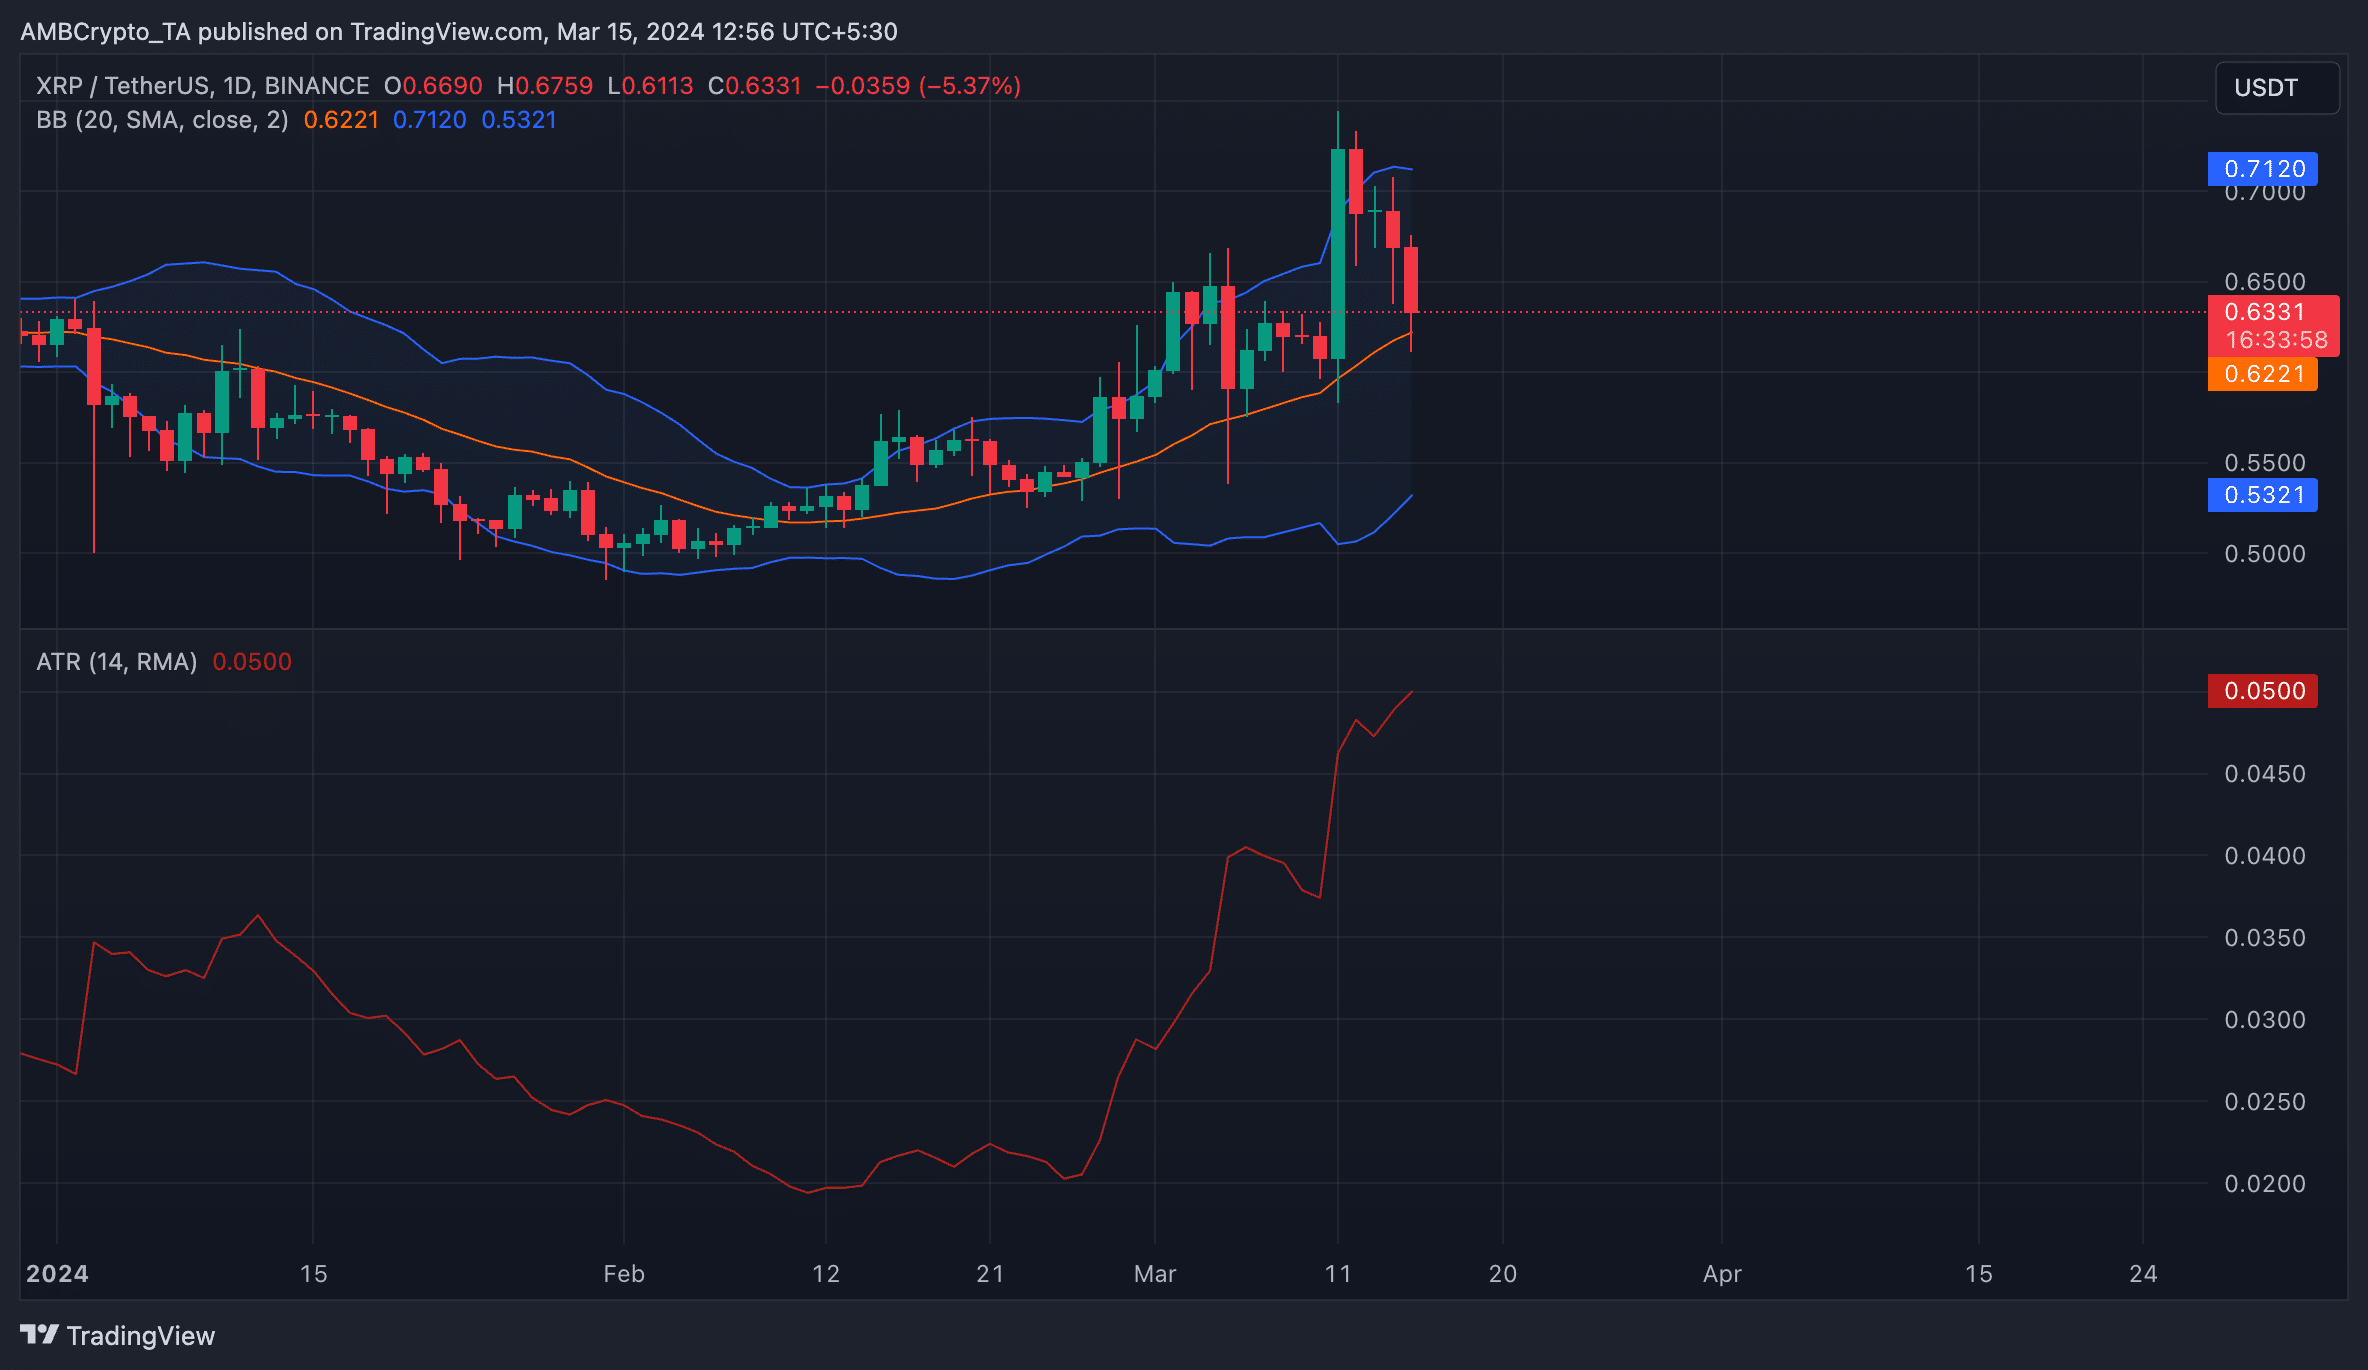
AMBCrypto’s assessment of the token’s volatility markers on a daily chart suggested the possibility of a further decline due to the significantly volatile nature of the market.
For example, a widening gap at press time separated the upper and lower bands of XRP’s Bollinger Bands (BB) indicator. Typically, a widening gap suggests that price movements are becoming more volatile.
With a negative weighted sentiment of -0.073, the possibility of a price swing to the downside remained strong.
Realistic or not, here’s XRP market cap in BTC’s terms
Also confirming the highly volatile nature of XRP’s market is its Average True Range (ATR), which measures market volatility by calculating the average range between high and low prices over a specified number of periods.
XRP’s ATR increased by 25% in the last 24 hours. When this indicator rises in this manner, it signals an uptick in market volatility.
Source: ETH/USDT on TradingView







