
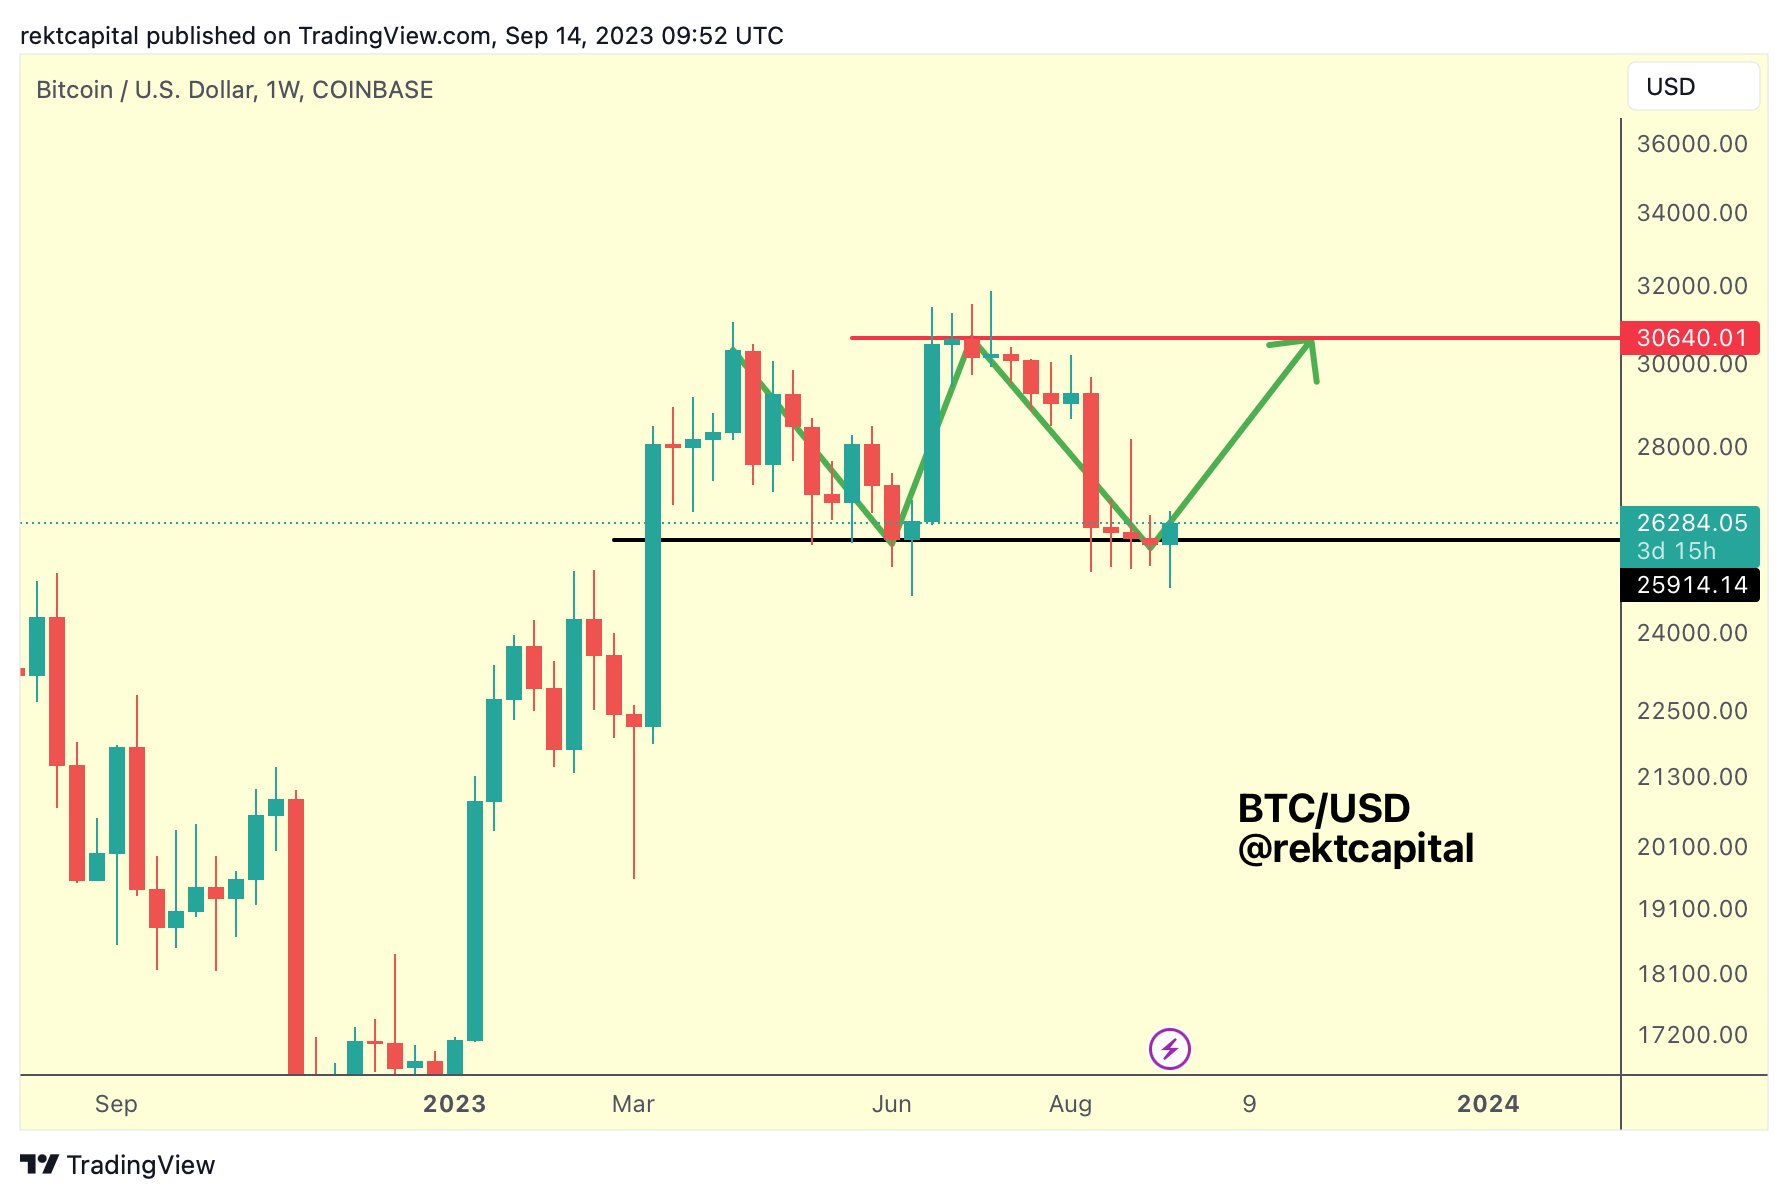
In recent days, Bitcoin has shown signs of a potential reversal, with the cryptocurrency charting three consecutive green daily candles. The last time such a pattern was observed was early July and between mid and late June, when Bitcoin rallied from just under $25,000 to over $31,000. This shift in price dynamics has led to a change in market sentiment, with the bearish outlook slowly giving way to a more bullish perspective.
While Bitcoin has successfully averted the confirmation of a double top on the 1-week chart fo the moment, this price action has fueled discussions among analysts about the possibility of Bitcoin forming a double bottom pattern, a significant technical indicator.
Bitcoin Double Bottom In The Making?
A double bottom is a classic technical analysis pattern that signifies a potential trend reversal from bearish to bullish in markets. It is characterized by two distinct troughs or lows in the price chart, separated by a peak or a minor high in between. The pattern resembles the letter “W,” with the first trough indicating a significant low, followed by a temporary rebound, and then a second trough, usually near the same price level as the first. A valid double bottom is confirmed when the price breaks above the peak or resistance level between the two troughs, signaling a potential upward trend reversal.
Rekt Capital, a renowned crypto analyst, recently shared his insights suggesting that Bitcoin’s current price pattern in the weekly chart resembles a double top, which typically indicates a bearish reversal. This pattern is characterized by an ‘M’ shape. However, for this to be confirmed, the price would need to break down from the $26,000 support. At press time, Bitcoin was trading at $26,618, successfully fending off the double top validation at the moment.
On the flip side, a double bottom, which forms a ‘W’ shape, would require Bitcoin to rebound from the $26,000 mark and tweeted today, “Could this BTC Double Top actually be a Double Bottom? And the simple answer is – technically, yes. […] But for BTC to form a Double Bottom, it would need to rebound from $26k and rally to $30.6k (which is its validation point).”
He further highlighted the challenges Bitcoin faces, noting the uncertainty surrounding the $26k support level and the numerous confluent resistances ahead, which might hinder the completion of the double bottom formation. Rekt Capital elaborated on the significance of the $26,000 level, tweeting, “It looks like BTC may be choosing the ‘relief rally’ route first in an effort to potentially turn old support into new resistance. The black Monthly level (~$27,200) is approximately confluent with the Bull Market support band as well.”
He also pointed to Bitcoin’s recent bearish monthly candle close for August, emphasizing that Bitcoin closed below approximately $27,150, thereby confirming it as a lost support. Therefore he warns that the current price move by Bitcoin could only be a relief rally to confirm $27,150 as new resistance before dropping into the $23,000 region.
“It’s possible BTC could rebound into ~$27,150, maybe even upside wick beyond it this September. […] $23,000 is the next major Monthly support now that ~$27150 has been lost,” he remarked.
More Resistance Levels For BTC Price
So it’s clear that BTC has a major resistance level of $27,150 to break before the bulls can even dream of confirming a double bottom pattern. But there are also other key resistances to overcome before $30,600 can be breached and the double bottom confirmed.
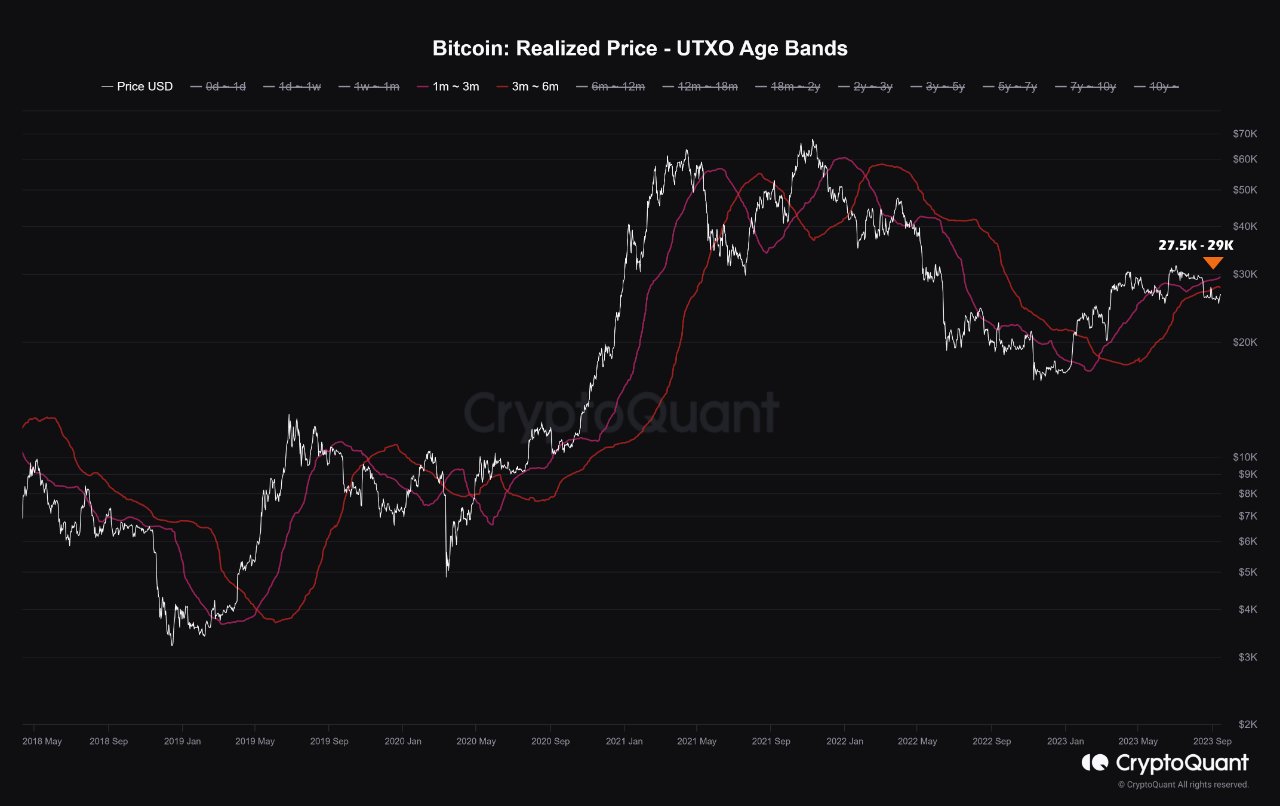
On-chain analysis firm CryptoQuant emphasized the role of short-term Bitcoin holders, who often provide the liquidity for significant price movements. According to their data, the break-even price for these holders lies between $27,500 and $29,000. If Bitcoin remains below these levels for an extended period, these holders might be incentivized to sell, potentially exerting downward pressure on the price:
The more time we spend below these price levels, the more incentive there will be to exit liquidity from the market, and the basis condition for the return of the upward trend of Bitcoin depends on the price jump above the short-term realized prices.
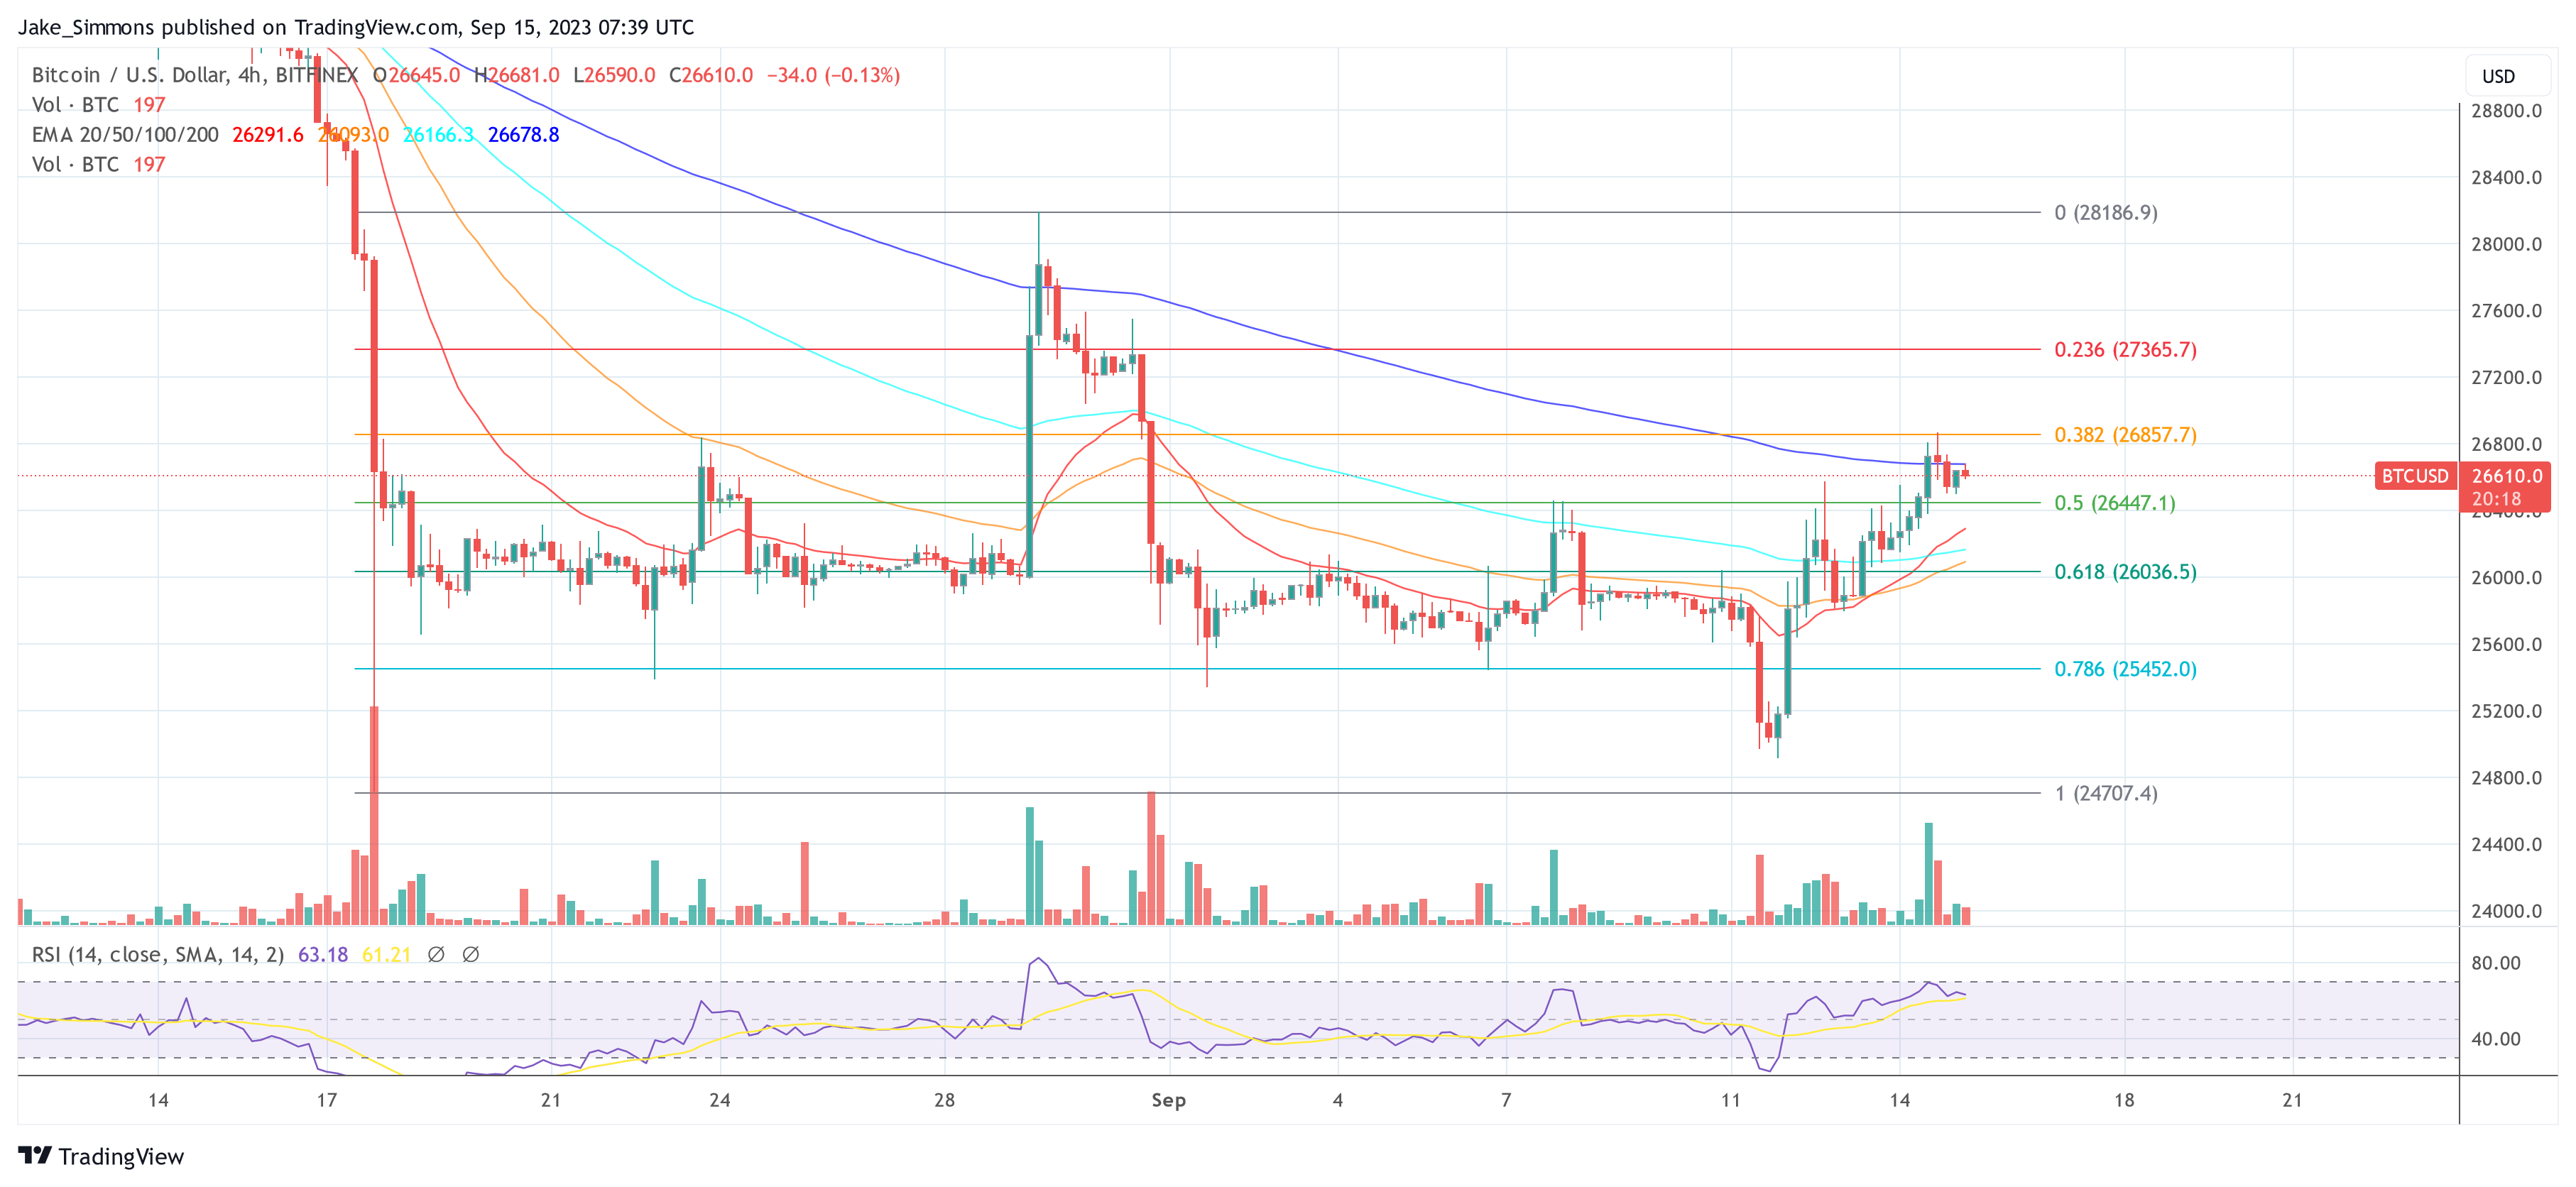
On the 4-hour time frame, BTC needs to overcome three major resistances: $26,857 (38.2% Fibonacci retracement level), $27,365 (23.6% Fibonacci retracement level) and $28,186 (post-Grayscale high from August 29th).
Featured image from iStock, chart from TradingView.com







