
Since its inception, Bitcoin has (almost) always been the poster child for volatility. Yet, the Bitcoin price is hardly moving in any direction at the moment. But the latest data suggests a surprising twist in the tale.
As per a recent report by on-chain data provider Glassnode, “Bitcoin markets are experiencing an incredibly quiet patch, with several measures of volatility collapsing towards all-time lows.” This raises the question: Are we entering a new era of Bitcoin price stability, or is the market misreading the signs?
Historical Context For The Volatility Of Bitcoin
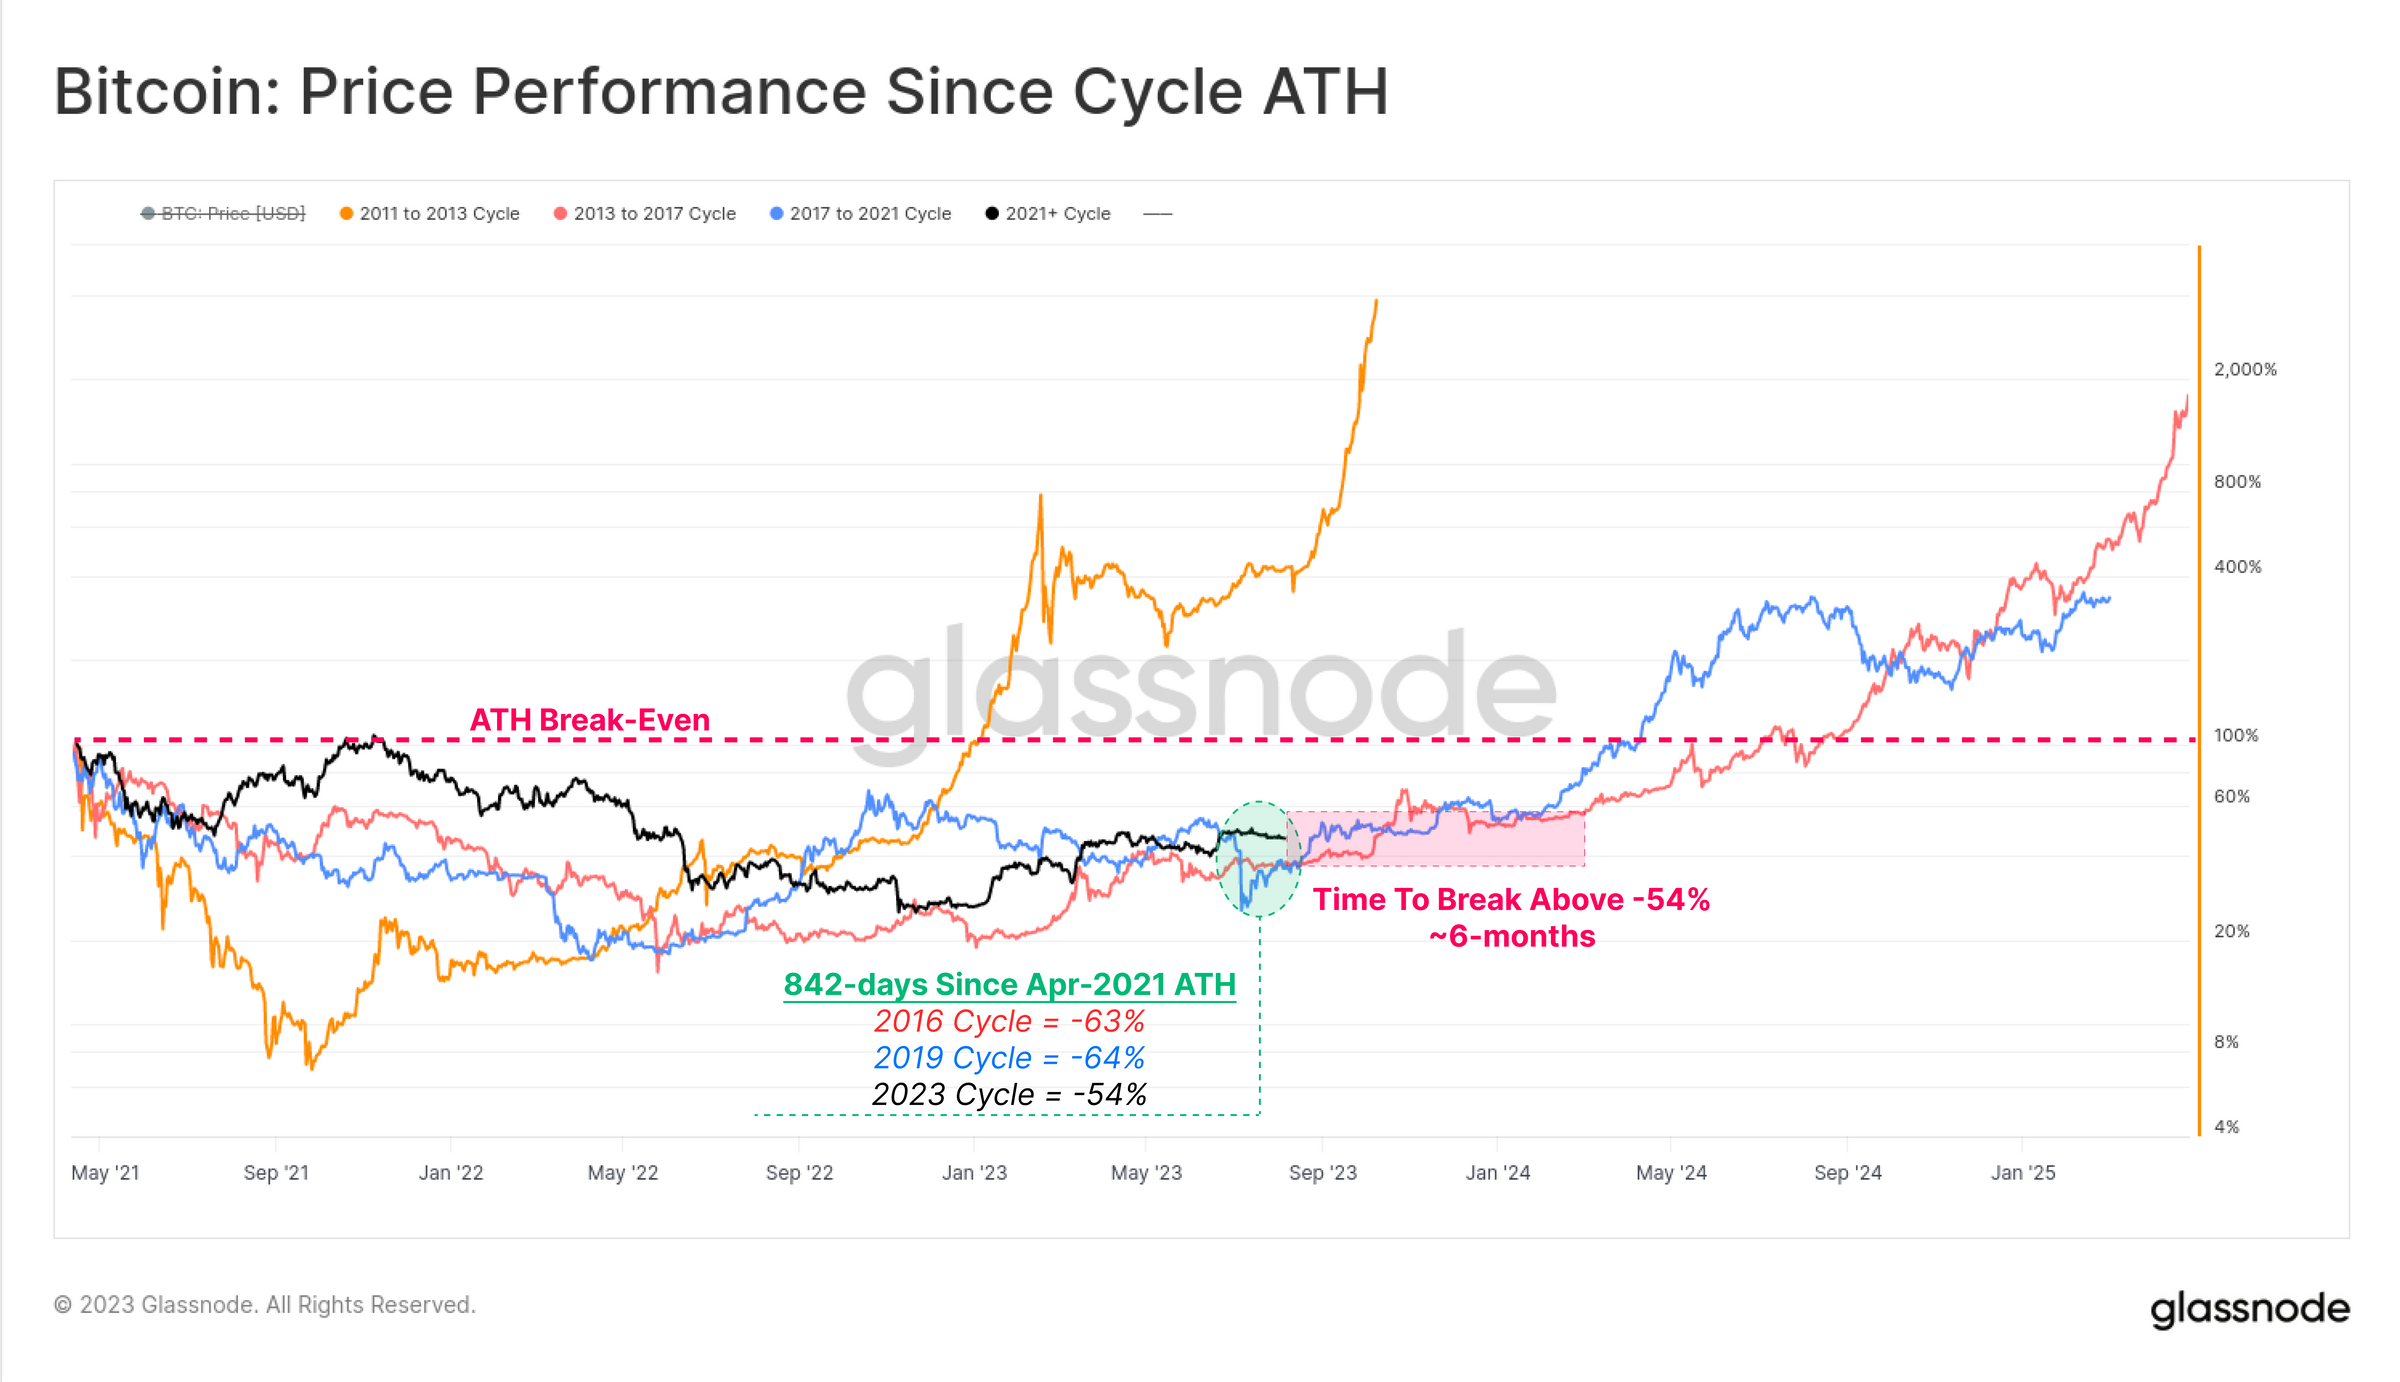
To truly understand the current state of the market, it’s essential to delve into the historical context. The Glassnode report notes, “It has been 842-days since the bull market peak was set in April 2021.” During this period, Bitcoin’s recovery has been more robust than in previous cycles, trading at -54% below its all-time high (ATH), compared to a historical average of -64%.
Drawing parallels with past cycles, the report highlights that both the 2015-16 and 2019-20 cycles underwent a “6-month period of sideways boredom before the market accelerated above the -54% drawdown level.” This could be indicative of a similar “boredom” phase in the current cycle.
One of the most striking revelations from the Glassnode report is the extreme volatility compression Bitcoin is currently undergoing. “Bitcoin realized volatility ranging from 1-month to 1-year observation windows has fallen dramatically in 2023, reaching multi-year lows.” This is reminiscent of four distinct periods in Bitcoin’s history, including the late stage of the 2015 bear market and the post-March 2020 consolidation following the outbreak of COVID-19.
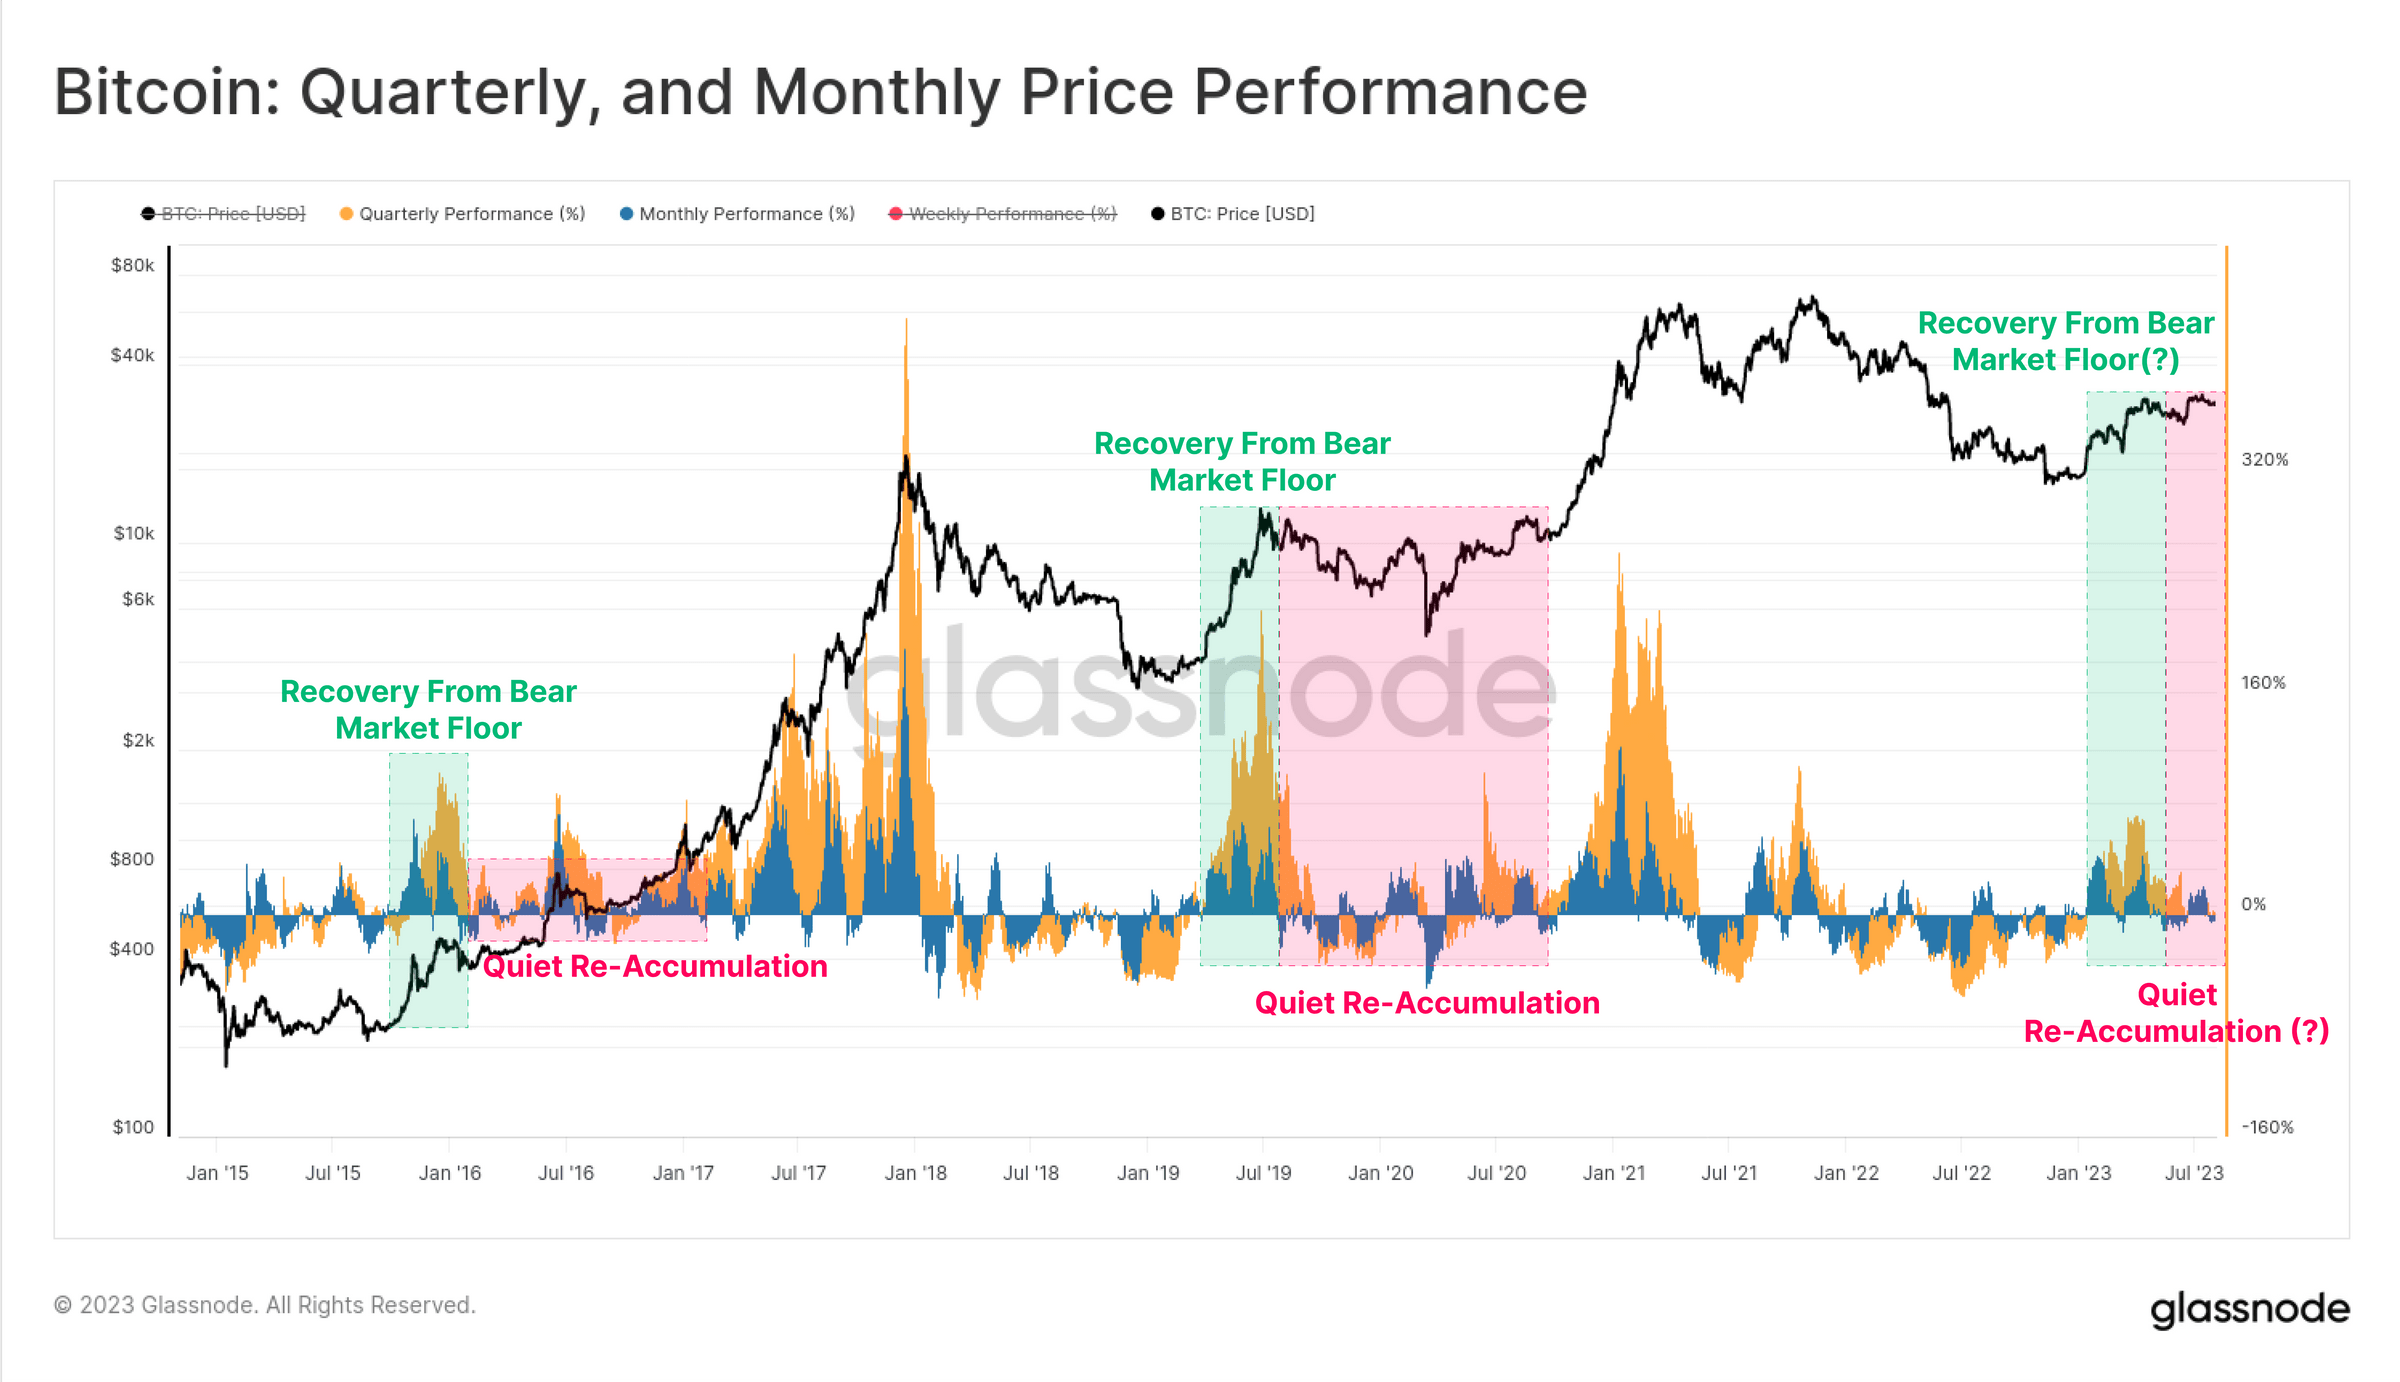
Following the furious rally at the beginning to 2023, the price performance on both a quarterly and monthly basis has moderated. This mirrors Bitcoin’s previous cycles where the initial surge from the low is robust, but then transitions into a prolonged phase of uneven consolidation, a phase of re-accumulation.
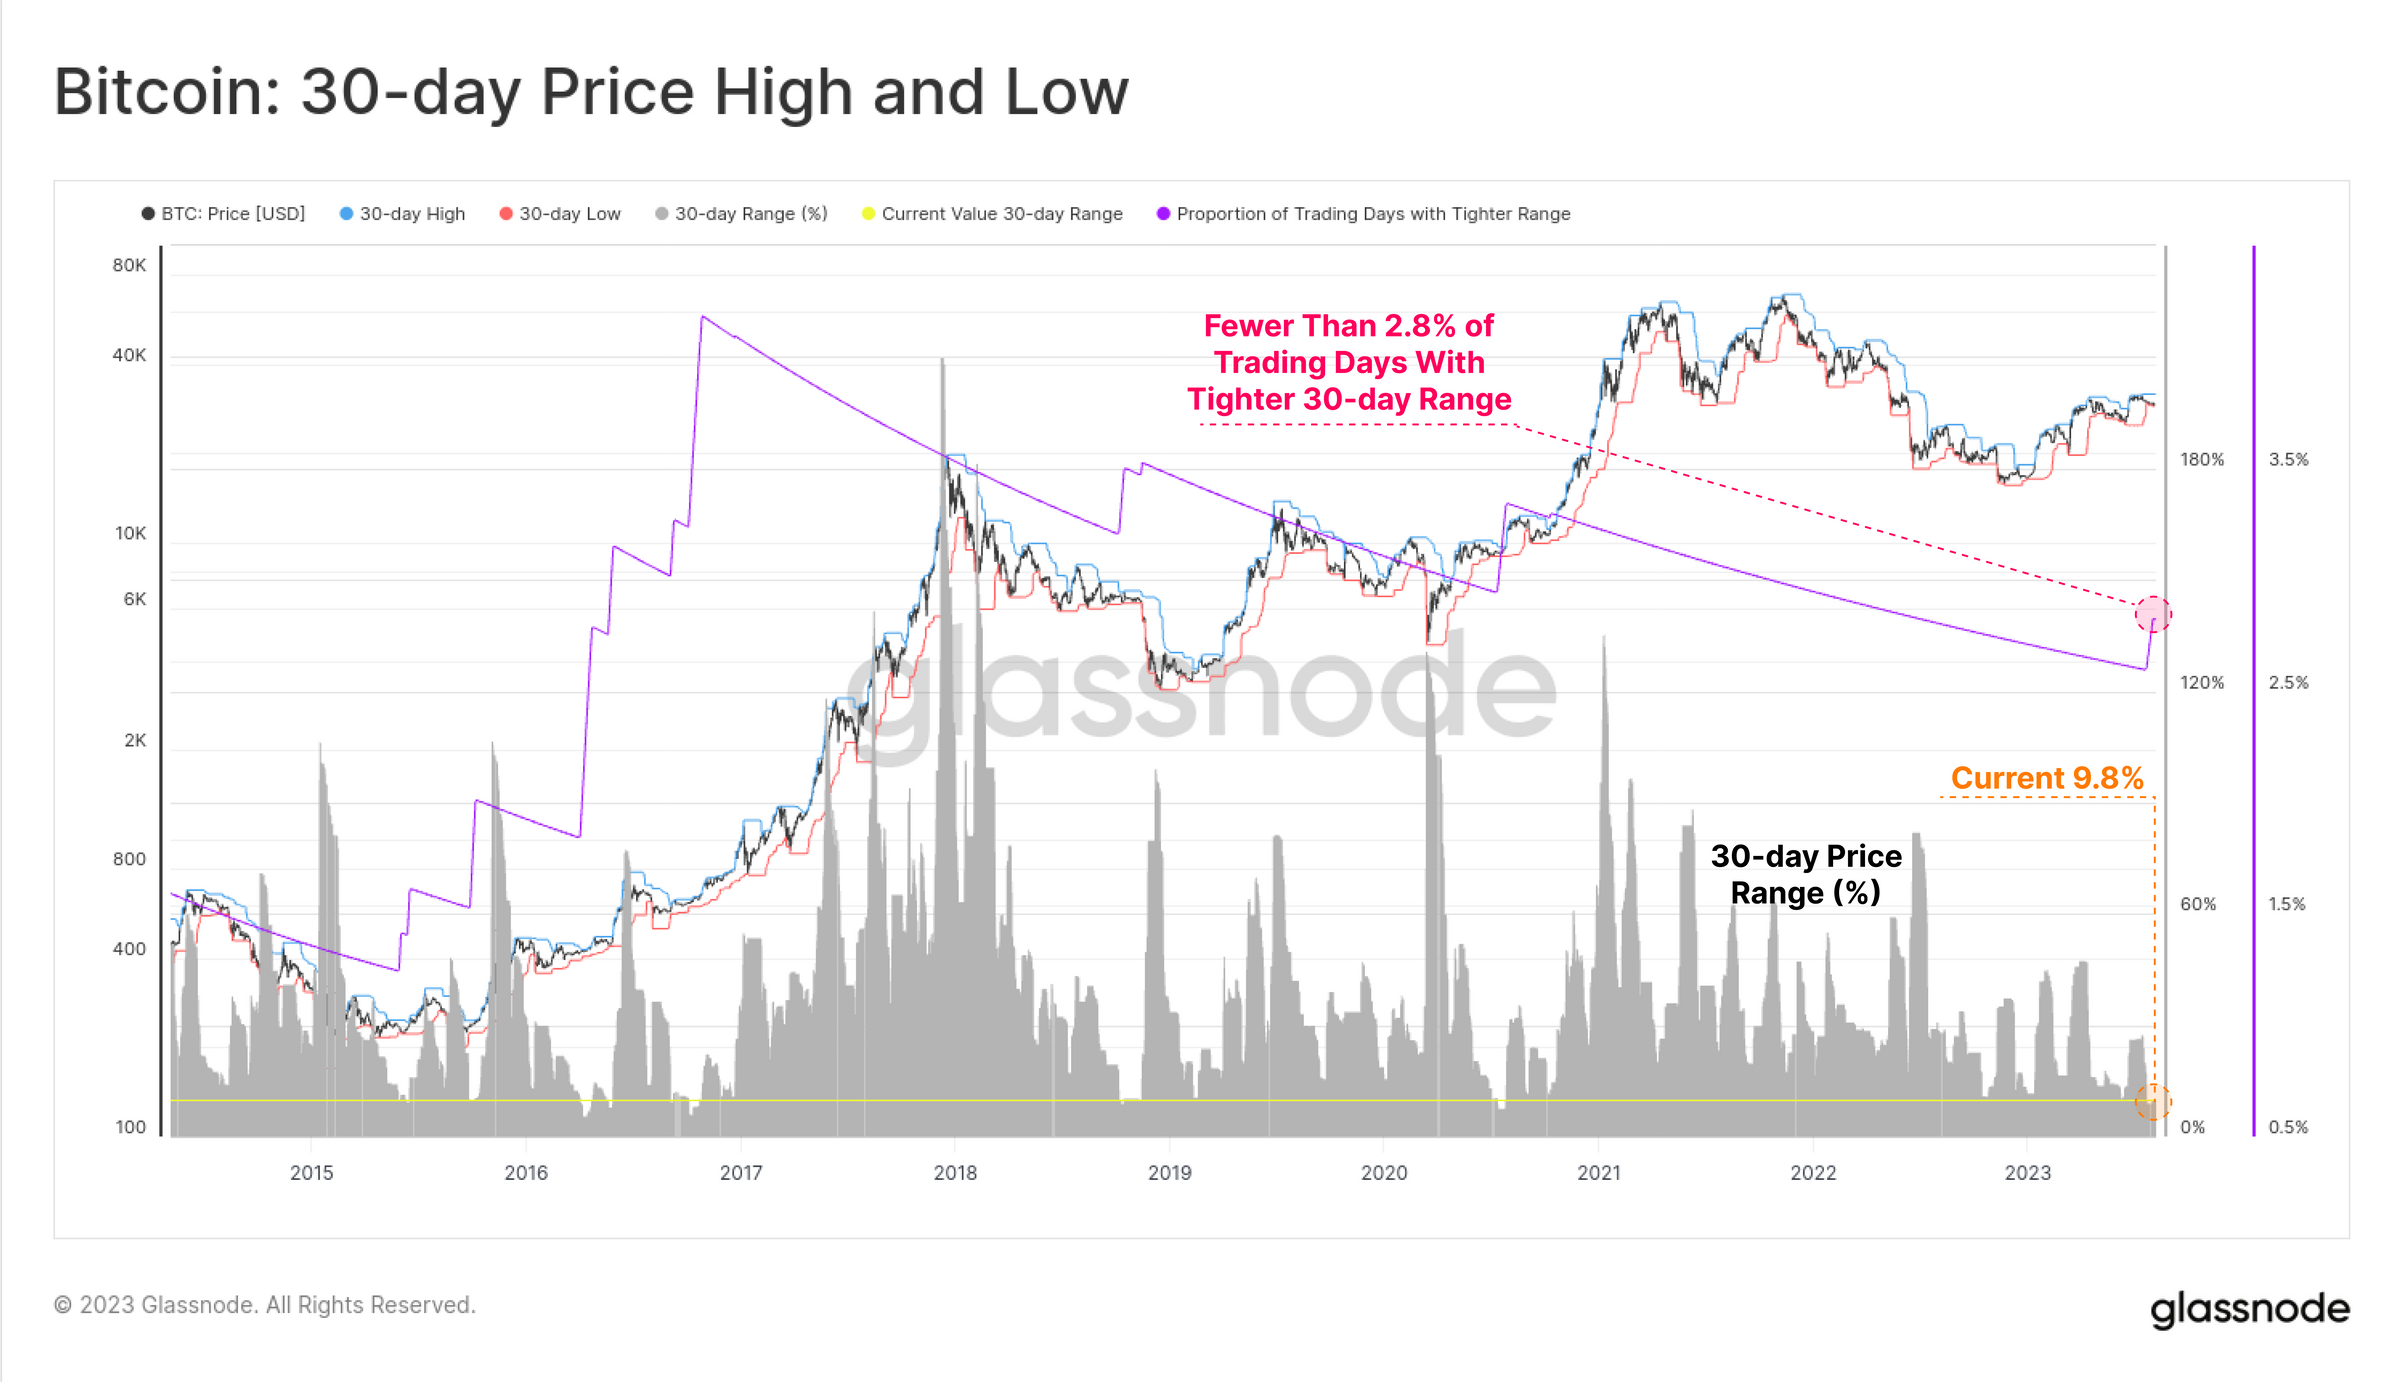
Furthermore, the report states, “The price range which separates the 7-day high and low is just 3.6%. Just 4.8% of all trading days have ever experienced a tighter weekly trade range.” The 30-day price range is even more extreme, constricting price to just a 9.8%, and with only 2.8% of all months in BTC’s history being tighter. Such levels of price compression are rare for Bitcoin, suggesting an anomaly or a potential precursor to a significant market move.
Derivatives Market Insights
The derivatives market, often seen as a barometer for underlying asset sentiment, is also echoing this quiet spell. “The combined Futures and Options trade volume for [BTC and ETH] are at, or approaching all-time-lows,” the report notes. This is further emphasized by the fact that “BTC is currently seeing $19.0B in aggregate derivatives trade volume, whilst ETH markets have just $9.2B/day.”
Interestingly, the options market is showing signs of a significant “volatility crush.” As per Glassnode, “Options are pricing in the smallest volatility premium in history, with IV between 24% and 52%, less than half of the long-term baseline.” This is further corroborated by the historically low Put/Call Ratio and the 25-delta skew metric, suggesting a net bullish sentiment in the market.
The crux of the matter lies in interpreting these signs. The report aptly questions, “Given the context of Bitcoin’s infamous volatility, is a new era of BTC price stability upon us, or is volatility mispriced?” Historically, periods of low volatility in Bitcoin have often been followed by significant price movements. Whether this is a calm before a storm or a genuine shift towards a more stable Bitcoin remains to be seen.
But as Tony “The Bull”, the chief chart technician at NewsBTC, has pointed out yesterday, the technical indicators are also pointing to a prolonged period of re-accumulation, meaning that the phase of low volatility is likely to continue for some time to come.
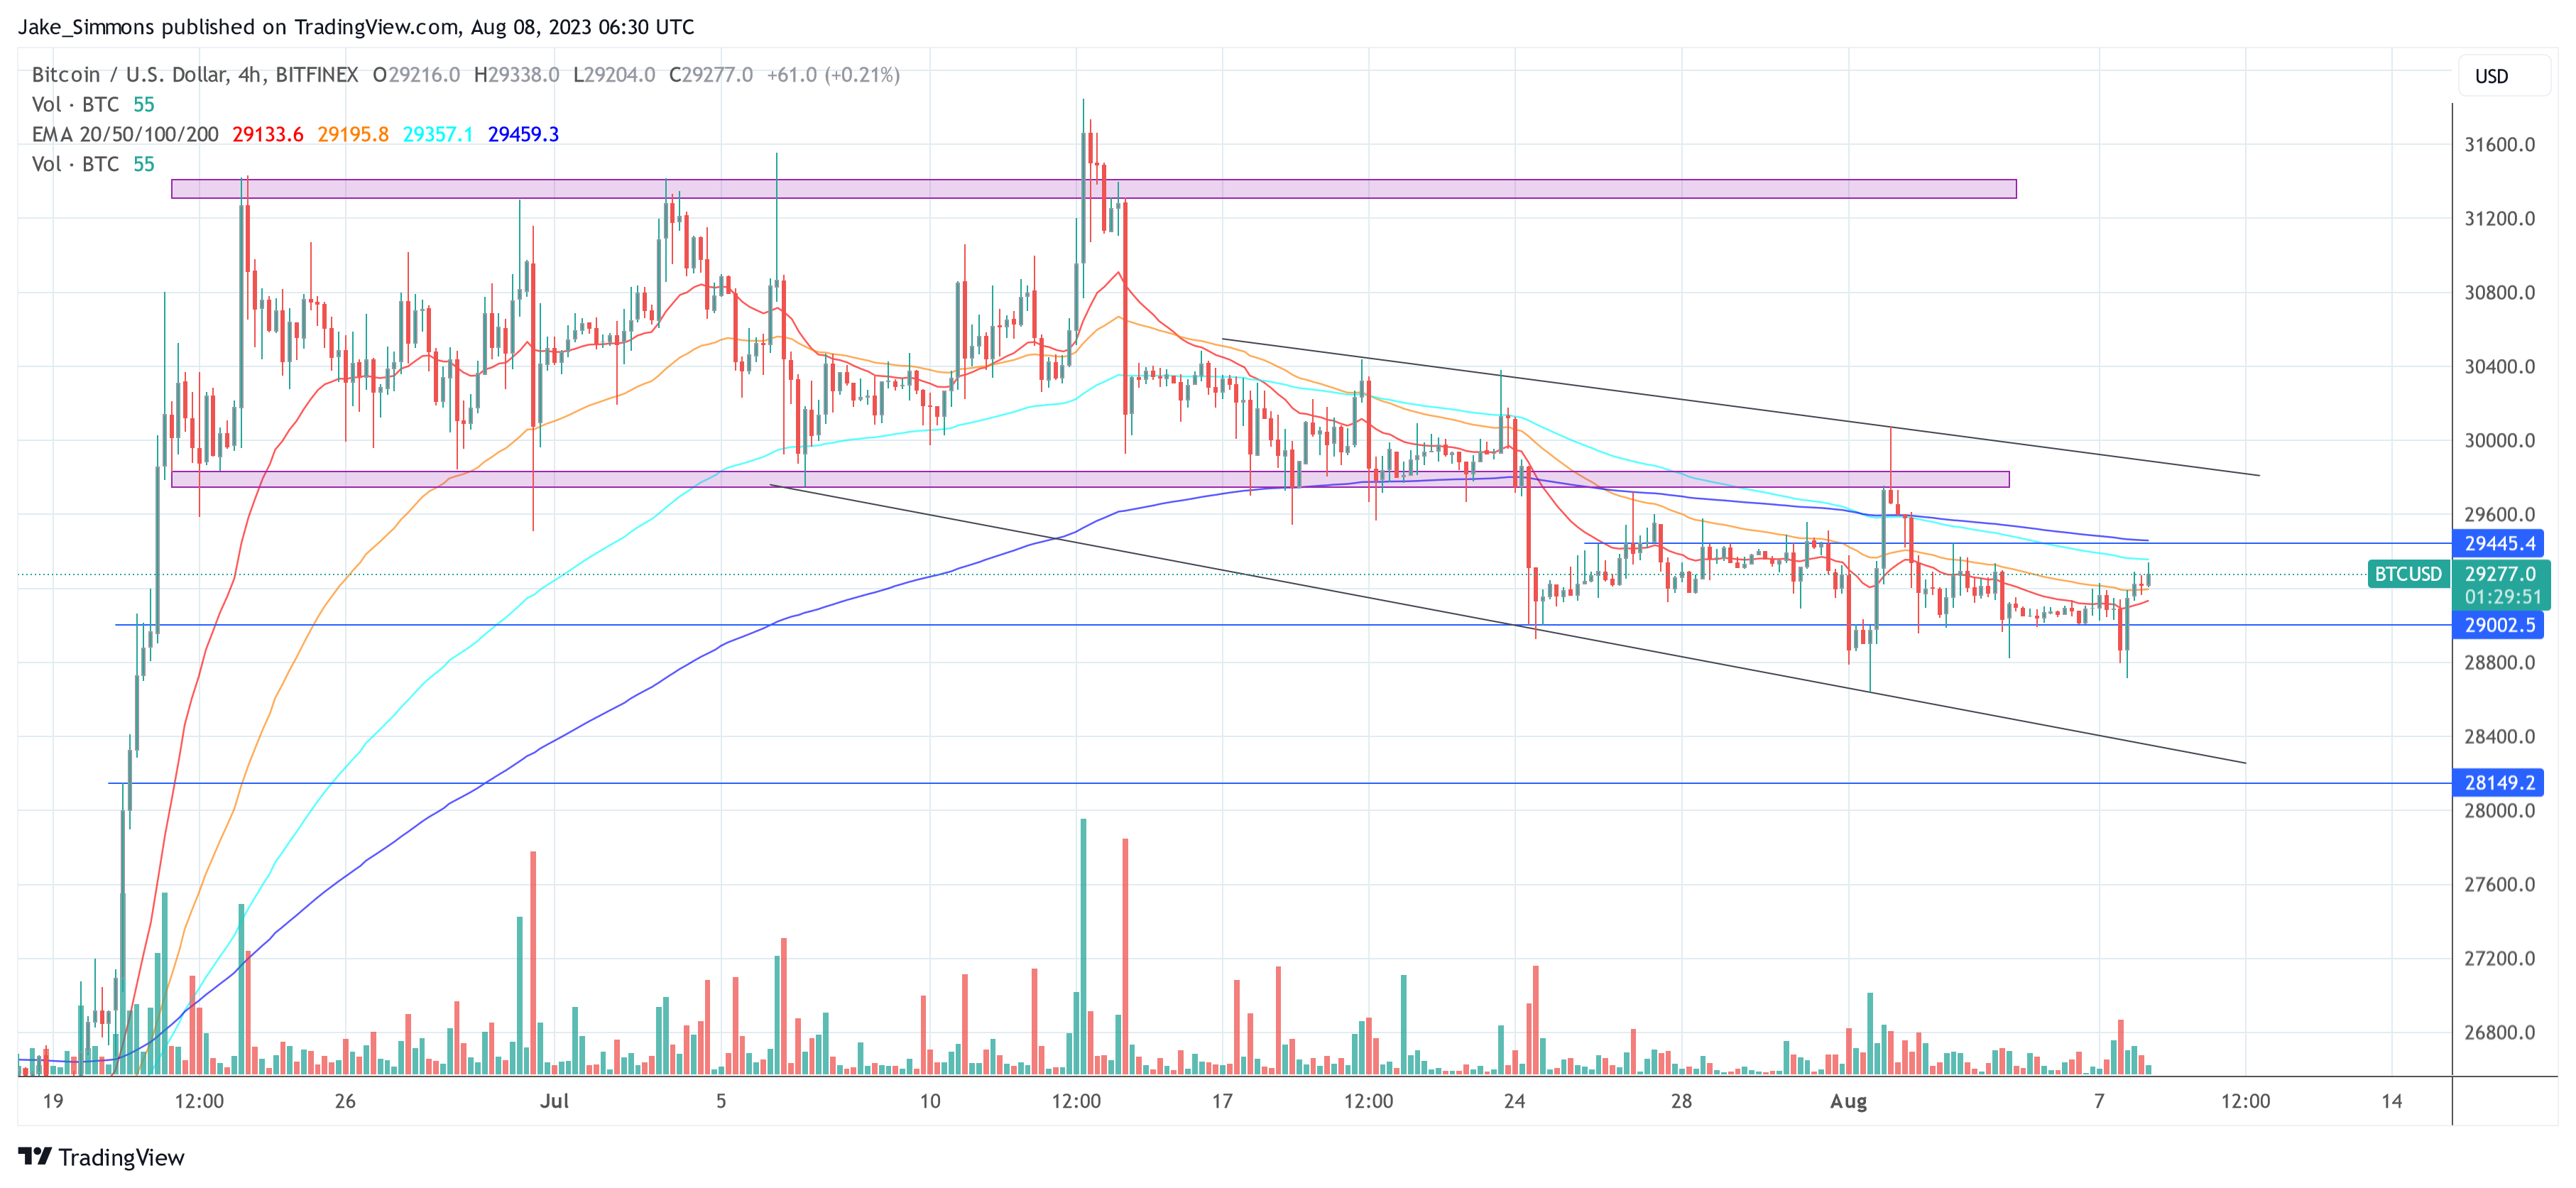
At press time, the BTC price was at $29,277.
Featured image from iStock, chart from TradingView.com







