
- Ethereum transaction fee fell to a four-month low on the charts
- This could be a sign of a decline in user activity on the network
According to Santiment’s latest update, Ethereum’s [ETH] transaction fees have fallen to their lowest level since January.
Santiment revealed that the average fee per transaction on the Proof-of-stake (PoS) network was $2.34, at press time. This represented an 84% decline from its year-to-date (YTD) peak of $15, recorded on 5 March.
💸 #Ethereum‘s network costs just $2.07 to make a transaction, a far cry from the $15.21 that it cost back on March 4th when demand was excessively high. The market historically moves between sentimental cycles of feeling that crypto is going “To the Moon” or feeling that “Crypto… pic.twitter.com/OKjhmHnYQE
— Santiment (@santimentfeed) April 18, 2024
Decline in network activity
The drop in Ethereum’s network fees is attributable to the fall in user activity on the blockchain over the past month. According to Artemis’ data, Ethereum has seen a decline in daily demand and activity over the last 30 days.
For example, the daily count of unique addresses interacting with Ethereum since 19 March has cratered by 7%. Due to this, the number of unique on-chain interactions with the network has dropped. With 1.2 million transactions completed on Ethereum on 17 April, the network has recorded a 14% drop in daily transaction count in the last 30 days.
The drop in user activity on Ethereum impacted the performance of its non-fungible token (NFT) and decentralized finance (DeFi) sectors too.
Regarding NFT activity on Ethereum, sales volume on the network has fallen significantly over the past month. According to CryptoSlam, NFT sales volume on the PoS network totalled $288 million in 30 days – Logging a 57% decline.
An indicator of decline in the network’s DeFi vertical is its total value locked (TVL). According to DefiLlama’s data, Ethereum’s TVL at press time was $49 billion, declining by 14% since its YTD peak of $57 billion.
Due to the drop in Ethereum’s network activity, ETH’s supply has turned inflationary. This means an uptick in the amount of ETH coins that are being created and added to the circulating supply, adding to the downward pressure on the altcoin’s price.
In fact, according to data from Ultrasound.money, ETH’s supply has risen by over 2,667 ETH over the past week alone.
ETH local top reached?
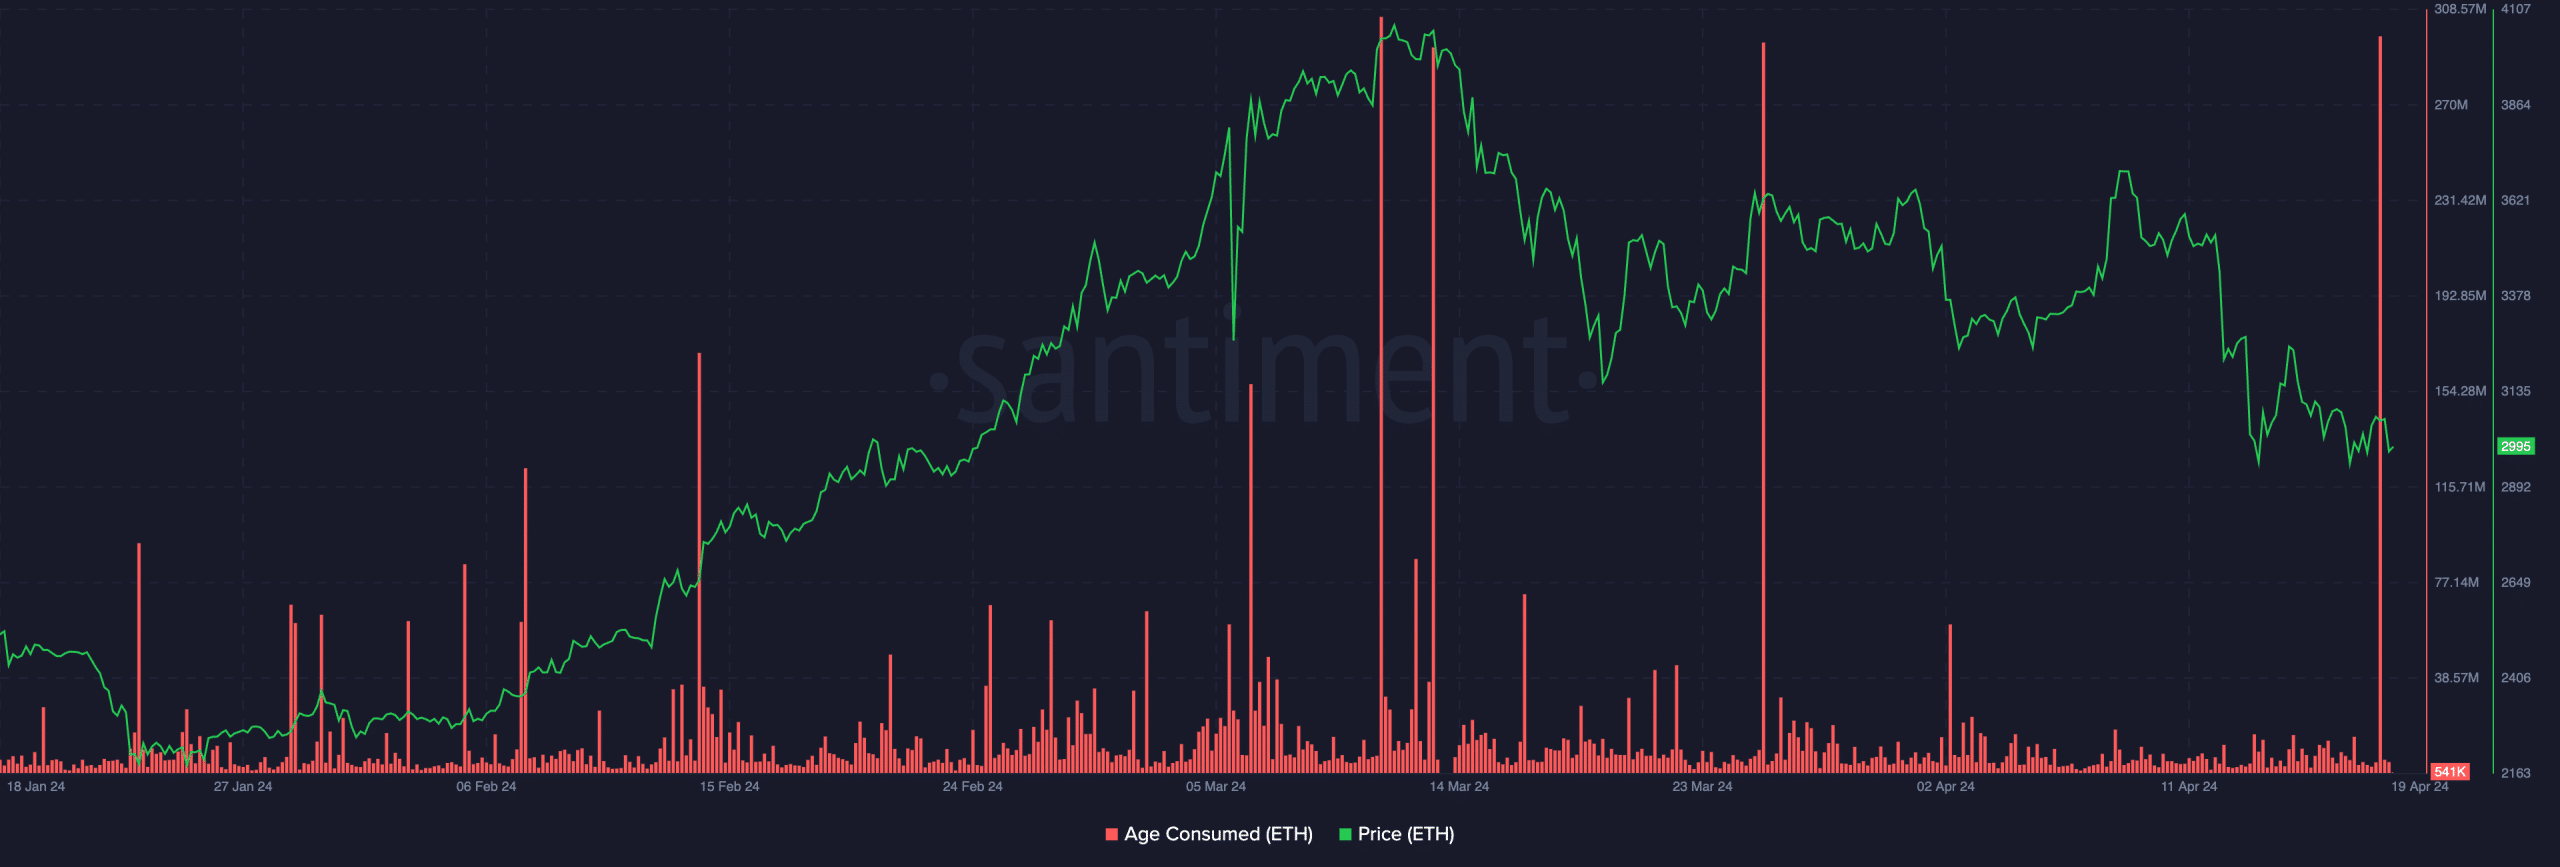
In its post, Santiment opined that the decline in Ethereum’s network fee may suggest that its price is near its bottom and that a rally may be on the horizon. To determine whether a price bottom is in, observing ETH’s Age Consumed metric is key. This metric tracks the movement of previously idle coins.
When the coin’s Age Consumed rallies, it suggests that many long-held and idle coins have begun to change hands. This indicates a strong shift in the behavior of long-term holders.
Is your portfolio green? Check the Ethereum Profit Calculator
On the other hand, a dip in ETH’s Age Consumed metric suggests that long-held coins remain in wallet addresses without being traded.
The metric is a good marker for local tops and bottoms because long-term holders rarely move their dormant coins around. Therefore, whenever this happens, it results in major shifts in market conditions.
According to Santiment’s data, ETH’s Age Consumed rose significantly on 18 April, confirming that a bottom might be in.
Source: Santiment
However, a cursory look at the past few times the coin’s Age Consumed recorded similar highs revealed that these episodes were followed by price declines – A sign that tops were reached. This may yet be the case for the world’s leading altcoin.
Also, current market sentiment remains significantly bearish, with the Bitcoin halving event less than 24 hours away. And, readings from the coin’s price chart suggest that it may already be priced in.







