
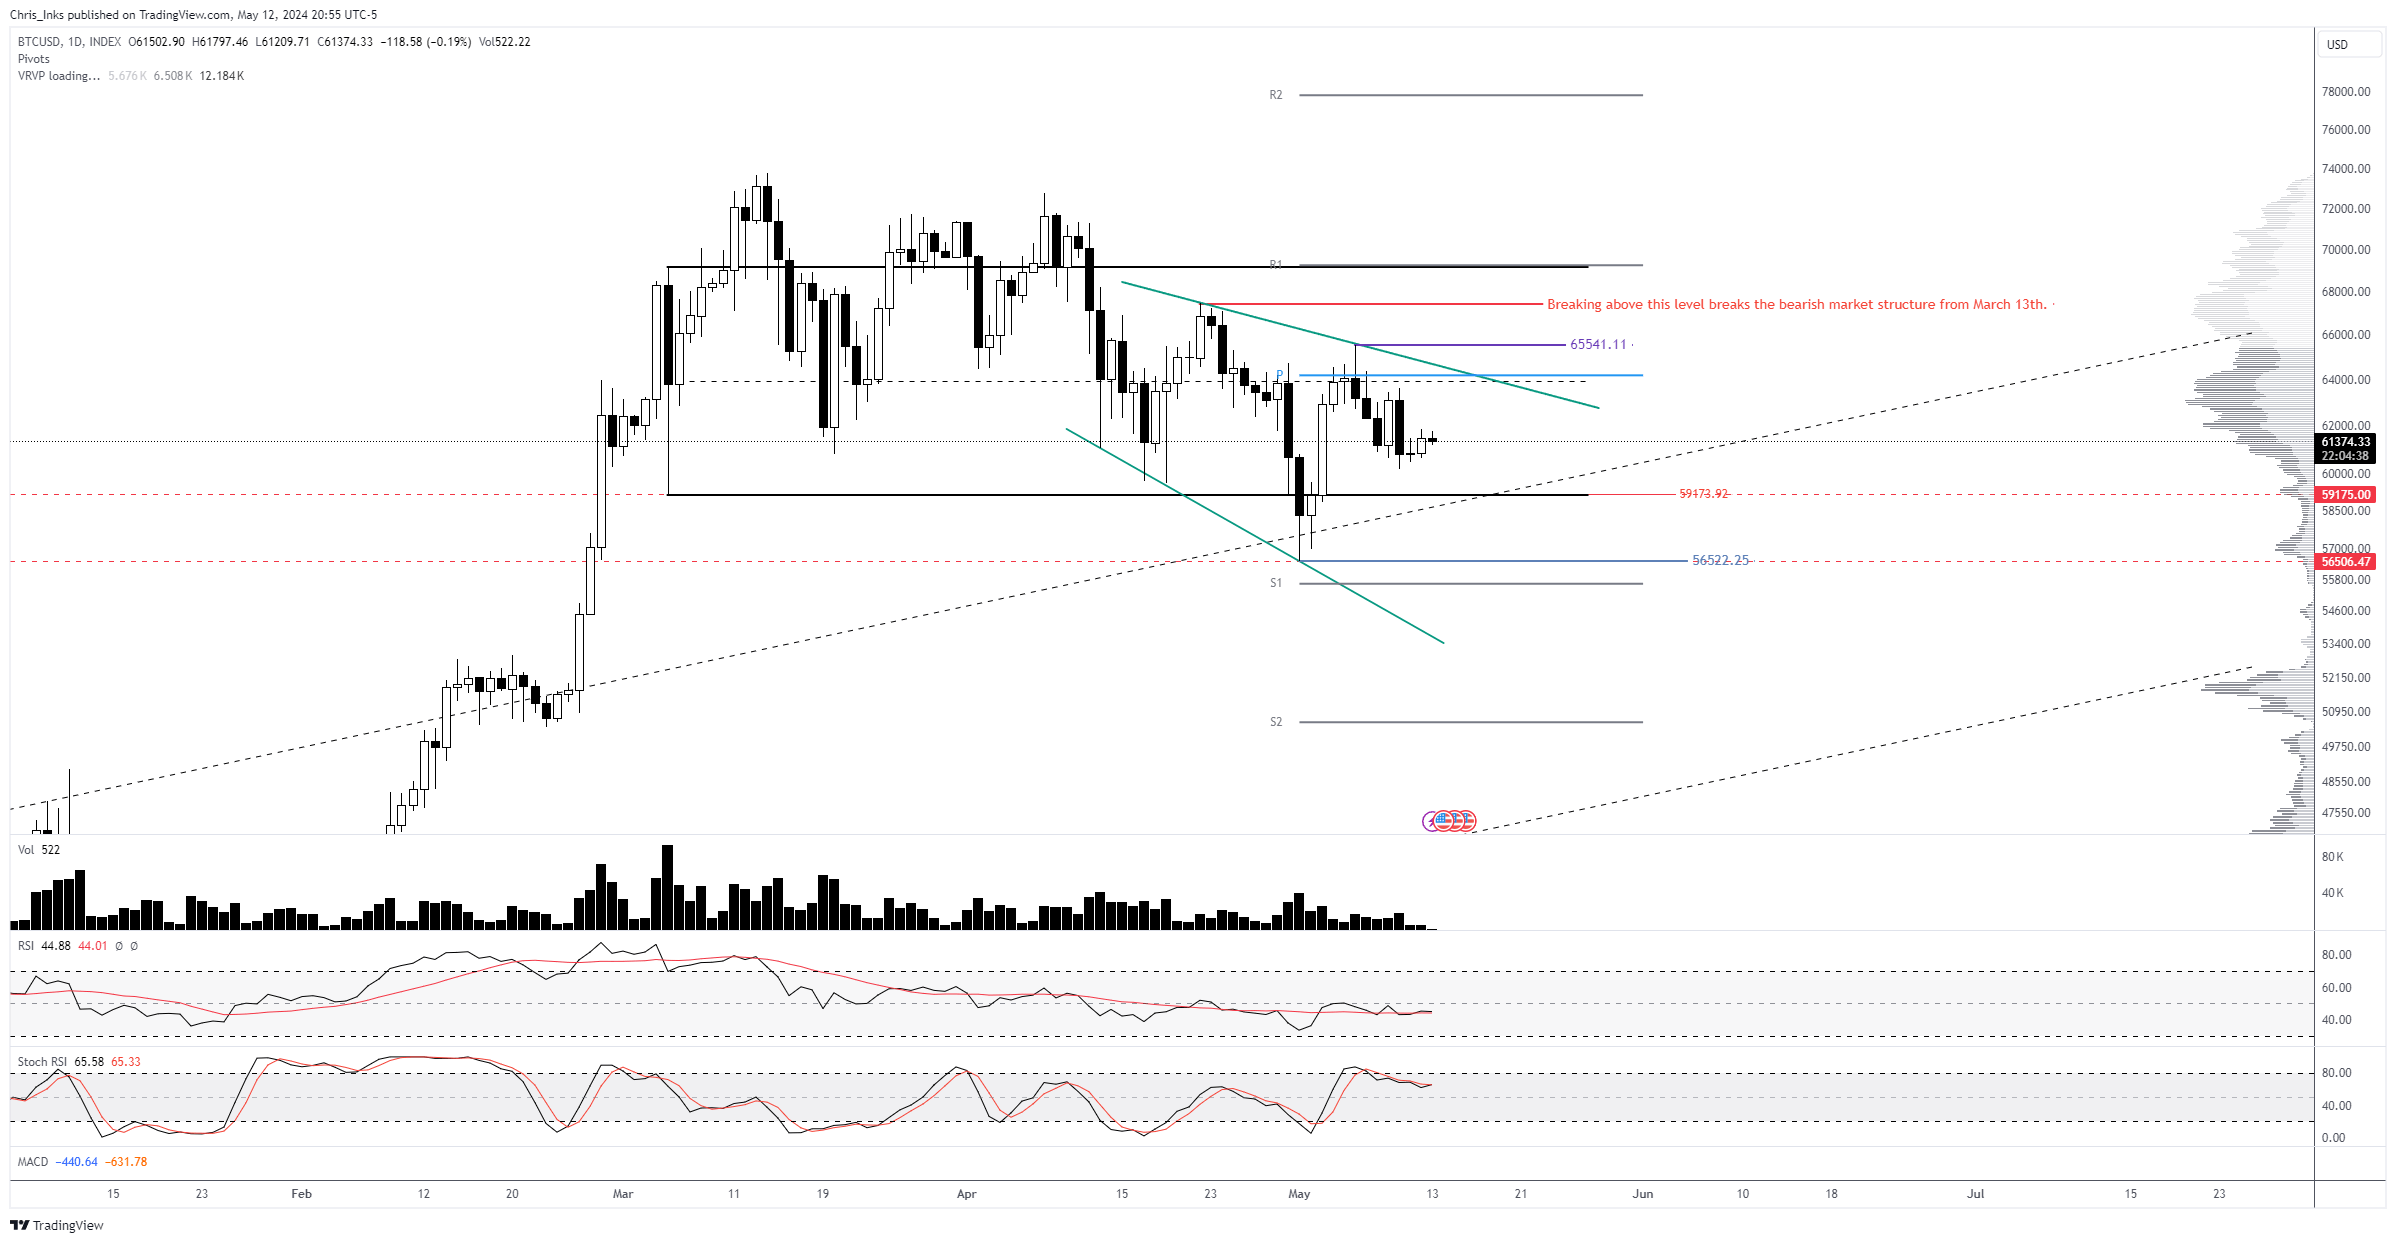
In his latest technical analysis, veteran crypto analyst Christopher Inks offers a detailed look at the current Bitcoin market structure through a comprehensive chart analysis. The chart, recently shared on X, shows Bitcoin’s price movements alongside several key technical indicators and levels that could signal a potential reversal from its bearish trend.
The analyst illustrates Bitcoin’s price action with daily candlesticks over the past few months, pinpointing significant support (S1, S2) and resistance (R1, R2) levels. As of press time, Bitcoin traded at around the $63,000 mark, encapsulated by two descending trend lines which represent a bearish market structure.
The Bottom Signal For Bitcoin
“We still want to see a breakout above the noted level to signal a break in the bearish market structure that began at the ATH,” Inks stated. This level is of paramount importance because it serves as a junction of multiple technical elements: the daily pivot point, the upper descending green resistance line, and the two-month range equilibrium.
Related Reading
According to Inks, “an impulsive breakout and close above the daily pivot/descending green resistance/2-month range EQ confluence area will signal that the low is likely in.” This suggests that overcoming this barrier could herald the end of the bearish market structure that commenced from the all-time high.
If this resistance breaks, the next major resistance is located at $65,541. Afterwards, $68,000 could be on the cards. “Breaking above this level breaks the bearish market structure from March 13th,” according to Inks. Then, R1 at $69,000 and R2 at around $78,000 could be the next targets.
On the downside, the most crucial support is at $56,522. It represents the lower boundary that Bitcoin needs to maintain to prevent a new low, which would exacerbate the bearish sentiment.
Related Reading
Inks articulates the importance of this support, noting, “If we can print a higher low now, which would require a breakout above the $65.541 level without printing a new low below $56,522, then that would really add support for the idea that the bottom is in and a new ATH is incoming.”
This statement underlines the necessity for Bitcoin to hold above this support to avoid further declines and stabilize within its current range. If BTC breaks below the pivotal support, the price could be headed below $56,000 (S1) and $50,90 (S2).
Notably, the analysis is supported by a variety of technical indicators. The Relative Strength Index (RSI), hovering around the neutral 50 mark, suggests a balancing act between bullish and bearish forces. The RSI’s position indicates that the market is neither overbought nor oversold, leaving room for potential upward movement if bullish signals strengthen.
The Moving Average Convergence Divergence (MACD) currently shows that the MACD line is below the signal line, a traditional bearish sign. However, the proximity of these lines also hints at a possible upcoming bullish crossover, should the momentum shift.
The Stochastic RSI also indicates potential for movement in either direction but is particularly useful for identifying when Bitcoin might be entering overbought or oversold territories, which are critical for predicting short-term price reversals.
Inks also commented on the market’s dynamics, stating, “The positives of the range are that supply has continued to decrease throughout the bearish market structure.” This observation suggests that diminishing supply, paired with maintaining key support levels, could help stabilize and potentially increase Bitcoin’s price.
At press time, BTC traded at $62,902.
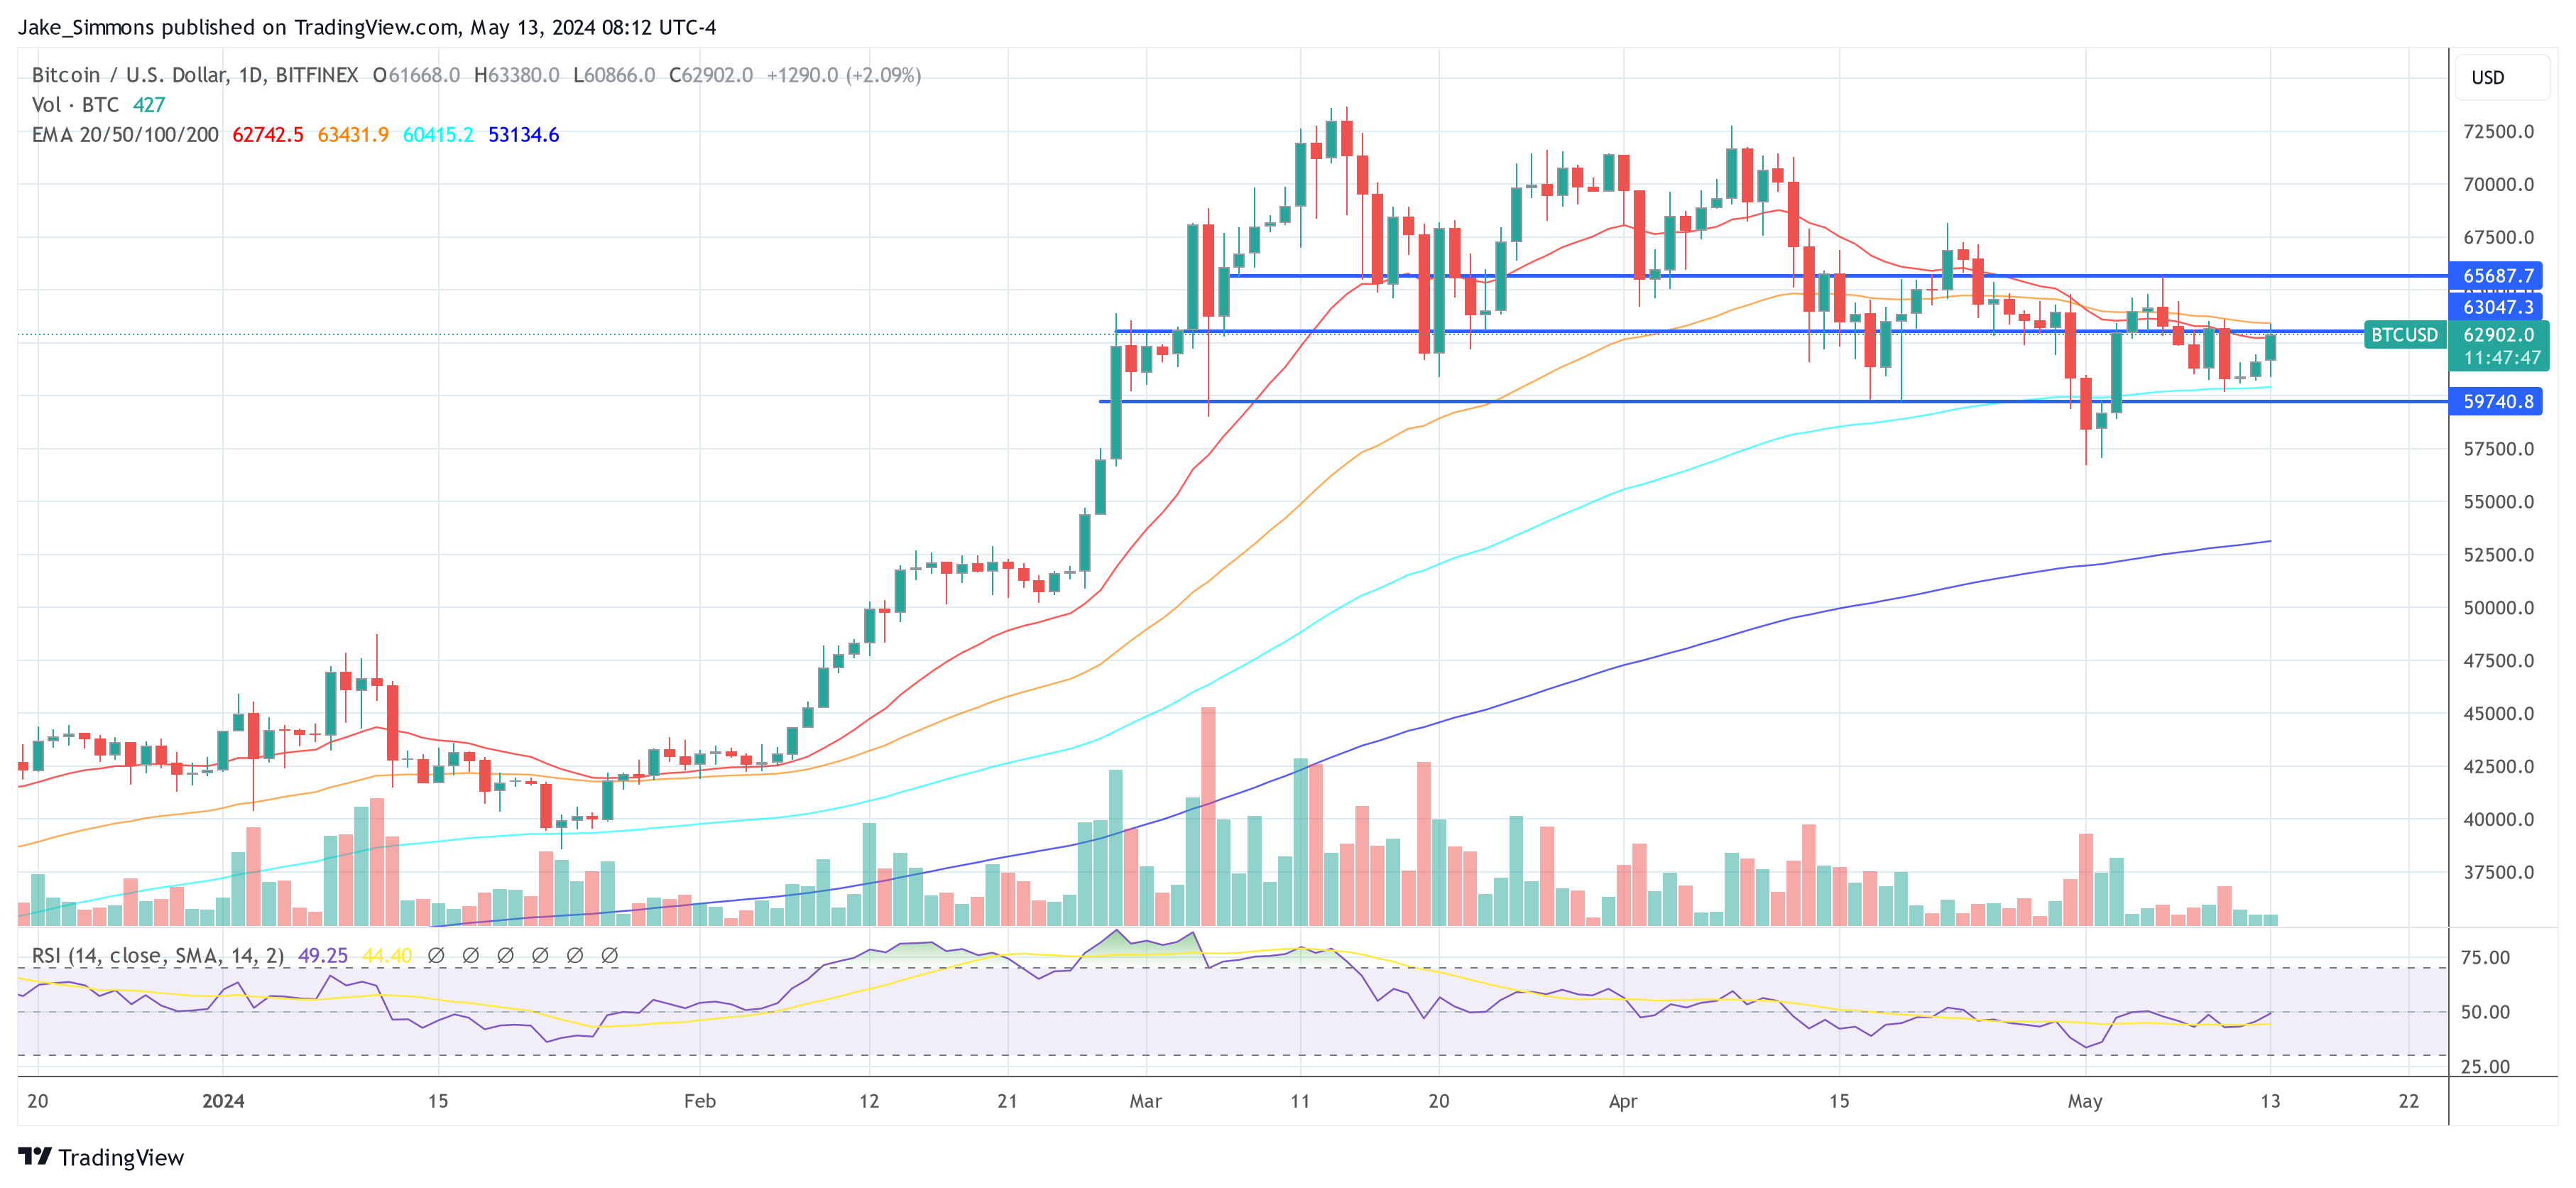
Featured image created with DALL·E, chart from TradingView.com







