
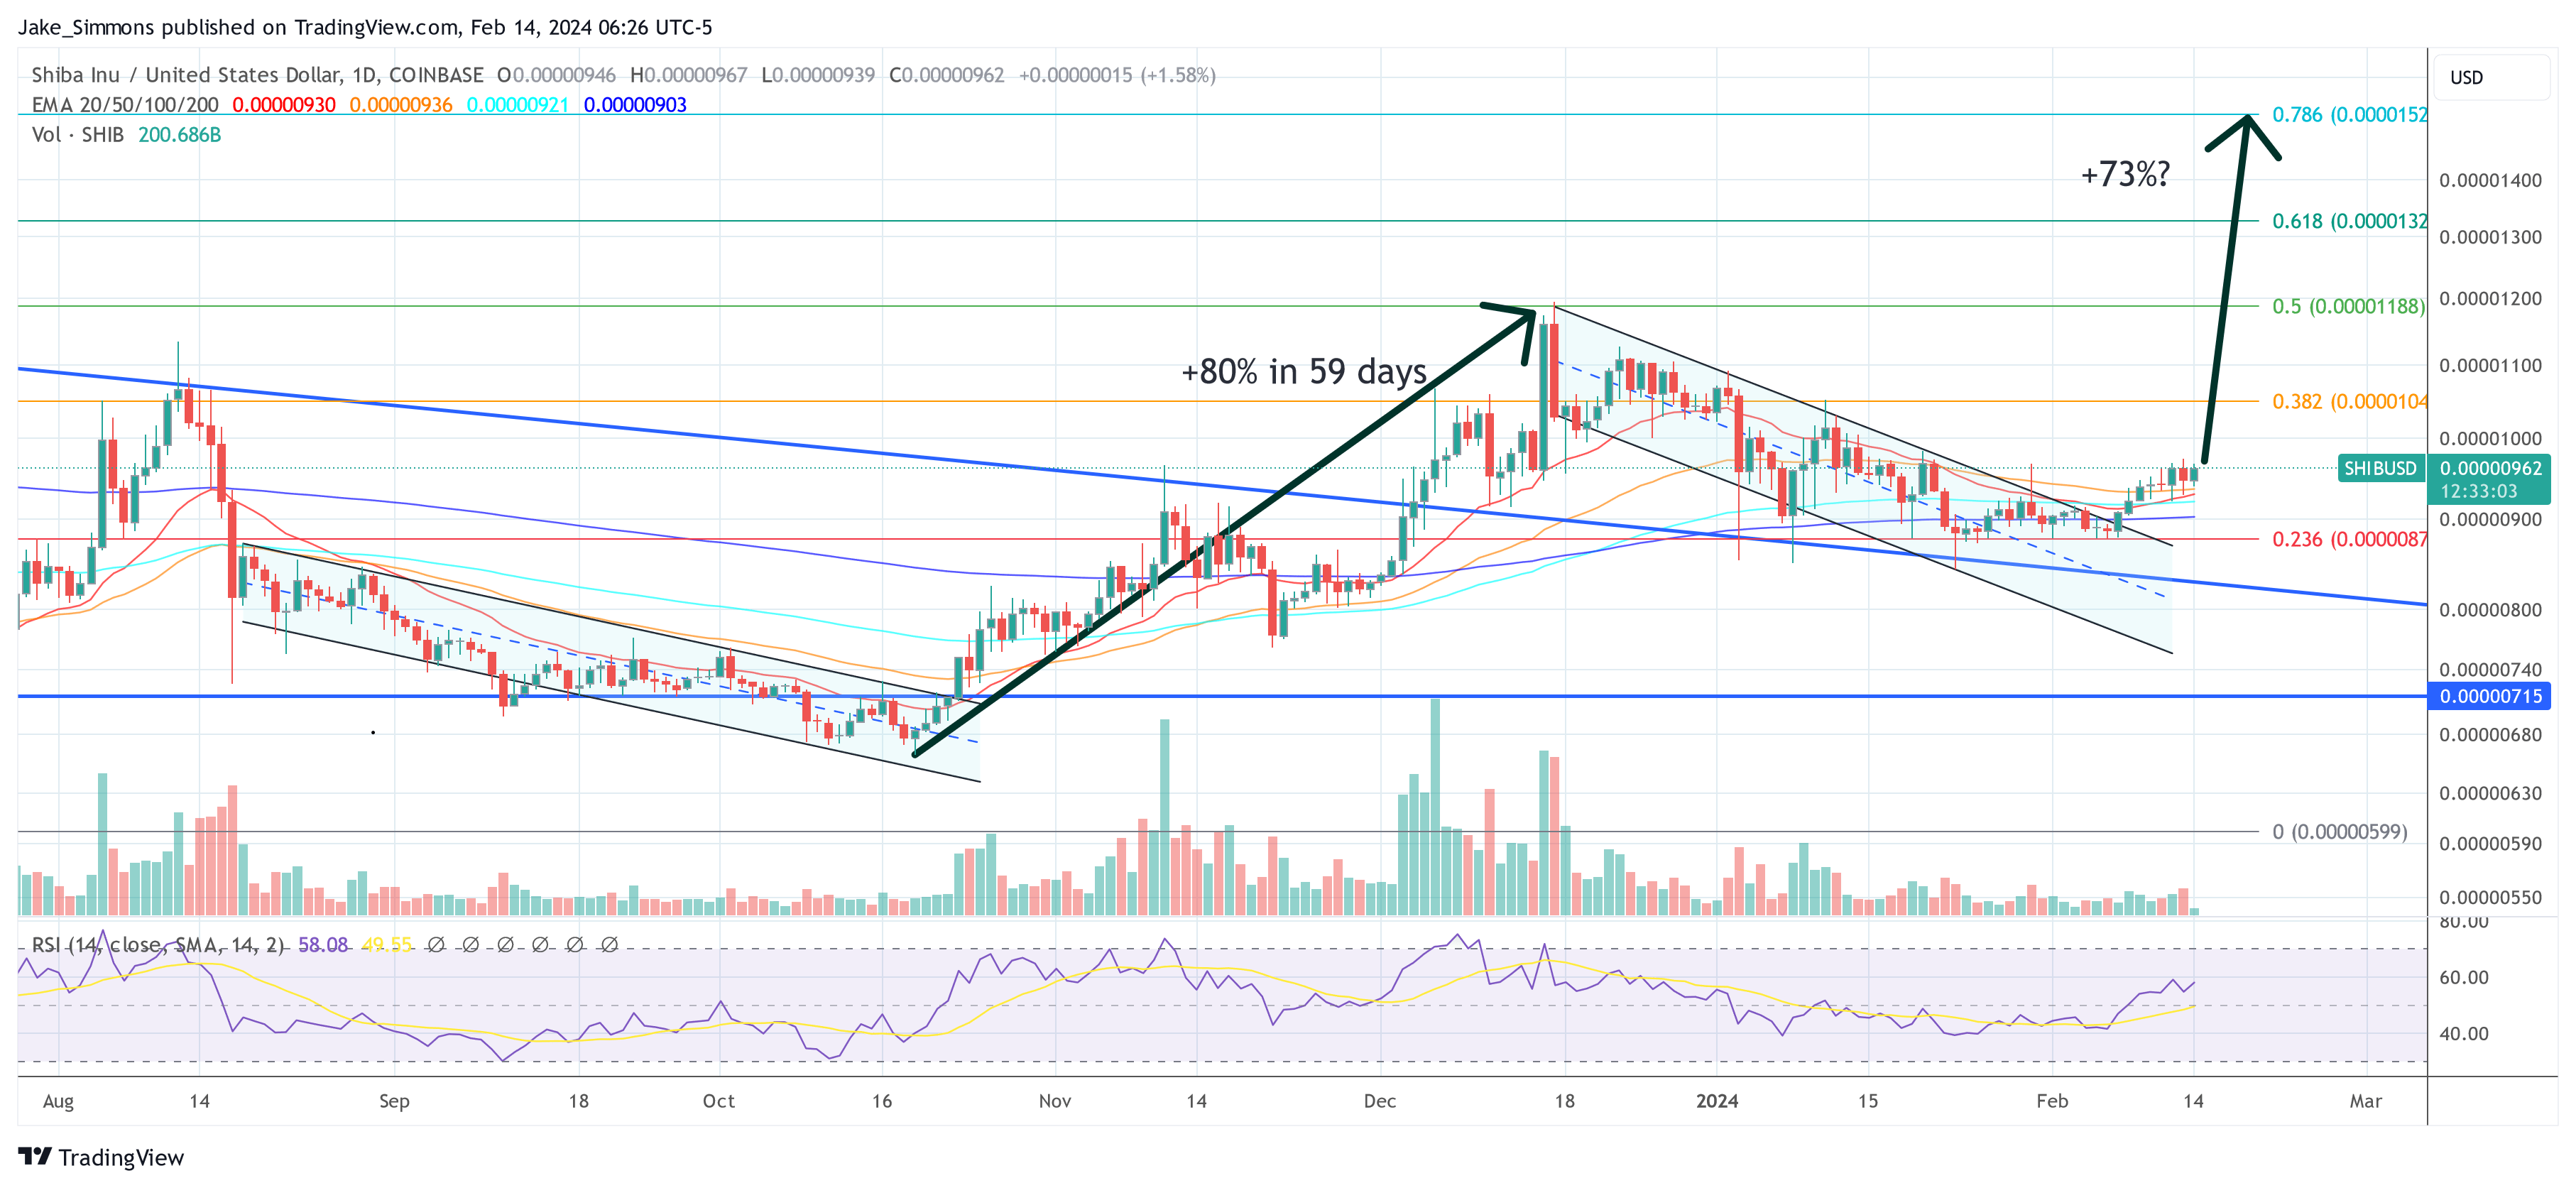
Over the past seven days, the Shiba Inu price has shown strong signs of a bullish reversal. A technical analysis of Shiba Inu (SHIB) against the US Dollar (USD) reveals a compelling narrative of a breakout from a bearish pattern that could signal a strong bullish reversal.
Shiba Inu Price Confirms Breakout
Since mid-December 2023, SHIB has been trading within a descending parallel channel, as observed on the daily chart. This channel, characterized by two parallel downward-sloping trendlines, has framed the price action, creating a series of lower highs and lower lows—a classic bearish signal within market structure.
The breakout from this channel occurred on Wednesday last week, February 7, with a decisive candle close above the upper trendline, a movement that is often indicative of a change in market sentiment. Remarkably, the price has also surged above the 200-day Exponential Moving Average (EMA).
With this bullish move, the price also shot above the 20, 50 and 100-day EMAs, suggesting a strong shift in momentum. The current breakout is particularly significant because it mirrors a historical price movement from October 2023, where SHIB also broke out of a descending channel and experienced an almost 80% increase in value over 59 days.
Investors and analysts closely monitor such patterns, as historical price actions can often repeat or rhyme in financial markets. If SHIB bulls can manage a similar rally, they could target the 0.786 Fibonacci retracement level at $0.00001525, marking a possible 73% rally.
In terms of other targets, the Fibonacci retracement levels drawn from the previous high to the low of the channel indicate significant levels of potential resistance and interest. The 0.618 Fibonacci level, often referred to as the ‘golden pocket,’ is particularly noteworthy as a key area where we might expect some selling pressure.
Currently, the 0.618 level lies at approximately $0.0000132, and the price is approaching this level with increased volume, signaling strong buying interest. Before that, the Shiba Inu price needs to overcome the 0.382 Fib at $0.00001049 and the 0.5 Fib at $0.00001188.
The Relative Strength Index (RSI) on the daily chart has moved above the midpoint of 50, which further validates the bullish momentum as it suggests that the buying pressure is outweighing the selling pressure.
Bullish Continuation Following Retest?
On the weekly timeframe, the RSI here also indicates a neutral momentum. The weekly SHIB/USD chart shows the breakout from a descending triangle pattern in early December 2023, followed by a successful retest at the end of January this year. The RSI on a weekly basis is now in neutral territory (at 54.6), ready for a renewed rally.
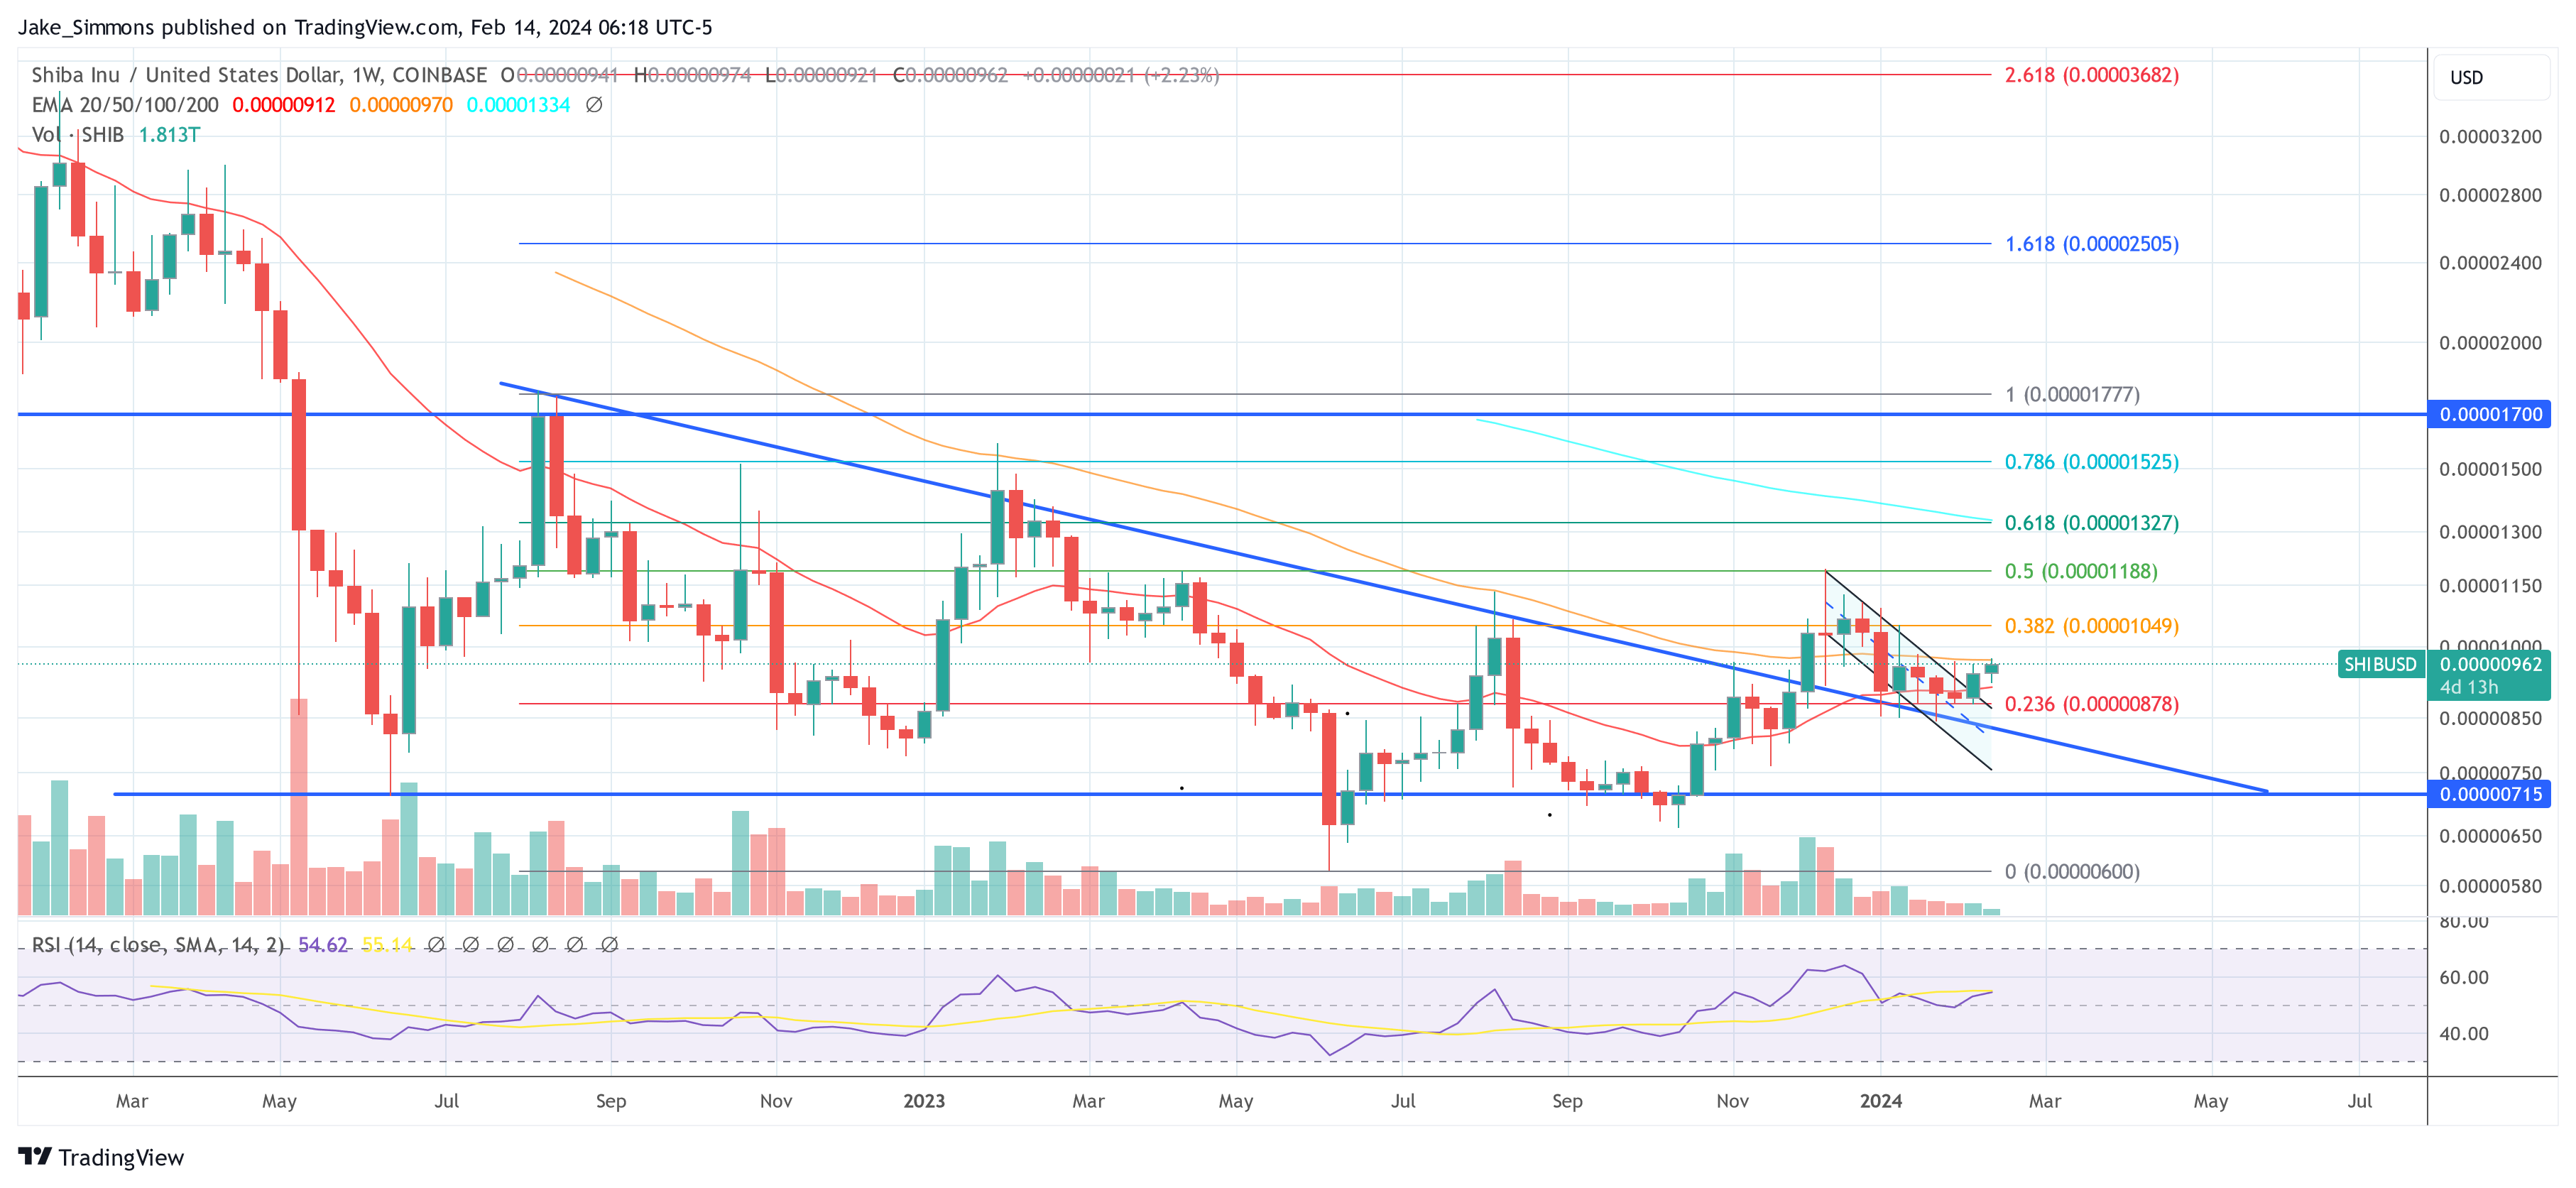
The weekly chart also displays the next crucial resistance which sits at $0.00000970 (the 50-week EMA). A weekly close above this threshold would further bolster the bullish case.
Ultimately, SHIB bulls could target the 100-week EMA, which stands at $0.00001334 and almost perfectly aligns with the “golden pocket” in the daily chart. The volume profile supports the breakout with a notable increase in buying volume as the price exited the channel. This adds credence to the sustainability of the breakout.
Overall, it is important to note that while a 73% rally is projected based on the pattern’s measured move, however, external factors could influence the actual price movement. Key resistance levels, such as the aforementioned Fibonacci levels, and the psychological round numbers should be monitored for potential pullbacks or consolidation.
Featured image created with DALL·E, chart from TradingView.com
Disclaimer: The article is provided for educational purposes only. It does not represent the opinions of NewsBTC on whether to buy, sell or hold any investments and naturally investing carries risks. You are advised to conduct your own research before making any investment decisions. Use information provided on this website entirely at your own risk.







