
In the dynamic realm of Bitcoin, the ability to discern patterns and trends from raw data is invaluable. Glassnode’s latest report, “Exhaustion and Apathy,” serves as a beacon, illuminating the intricate nuances of the current state of the market. Let’s delve deeper into the numbers and their implications.
Historic Lows In Bitcoin Volatility
The overarching theme of Glassnode’s findings is the unprecedented stagnation in Bitcoin’s volatility. The data reveals that the digital asset has been trading within a remarkably narrow $29,000 to $30,000 range. Historically, Bitcoin has been synonymous with volatility, making this current phase an anomaly.
The report underscores this by highlighting the Bollinger Bands’ tightness, noting, “The upper and lower Bollinger Bands are currently separated by just 2.9%.” Such constricted movement has been a rarity in Bitcoin’s tumultuous history.
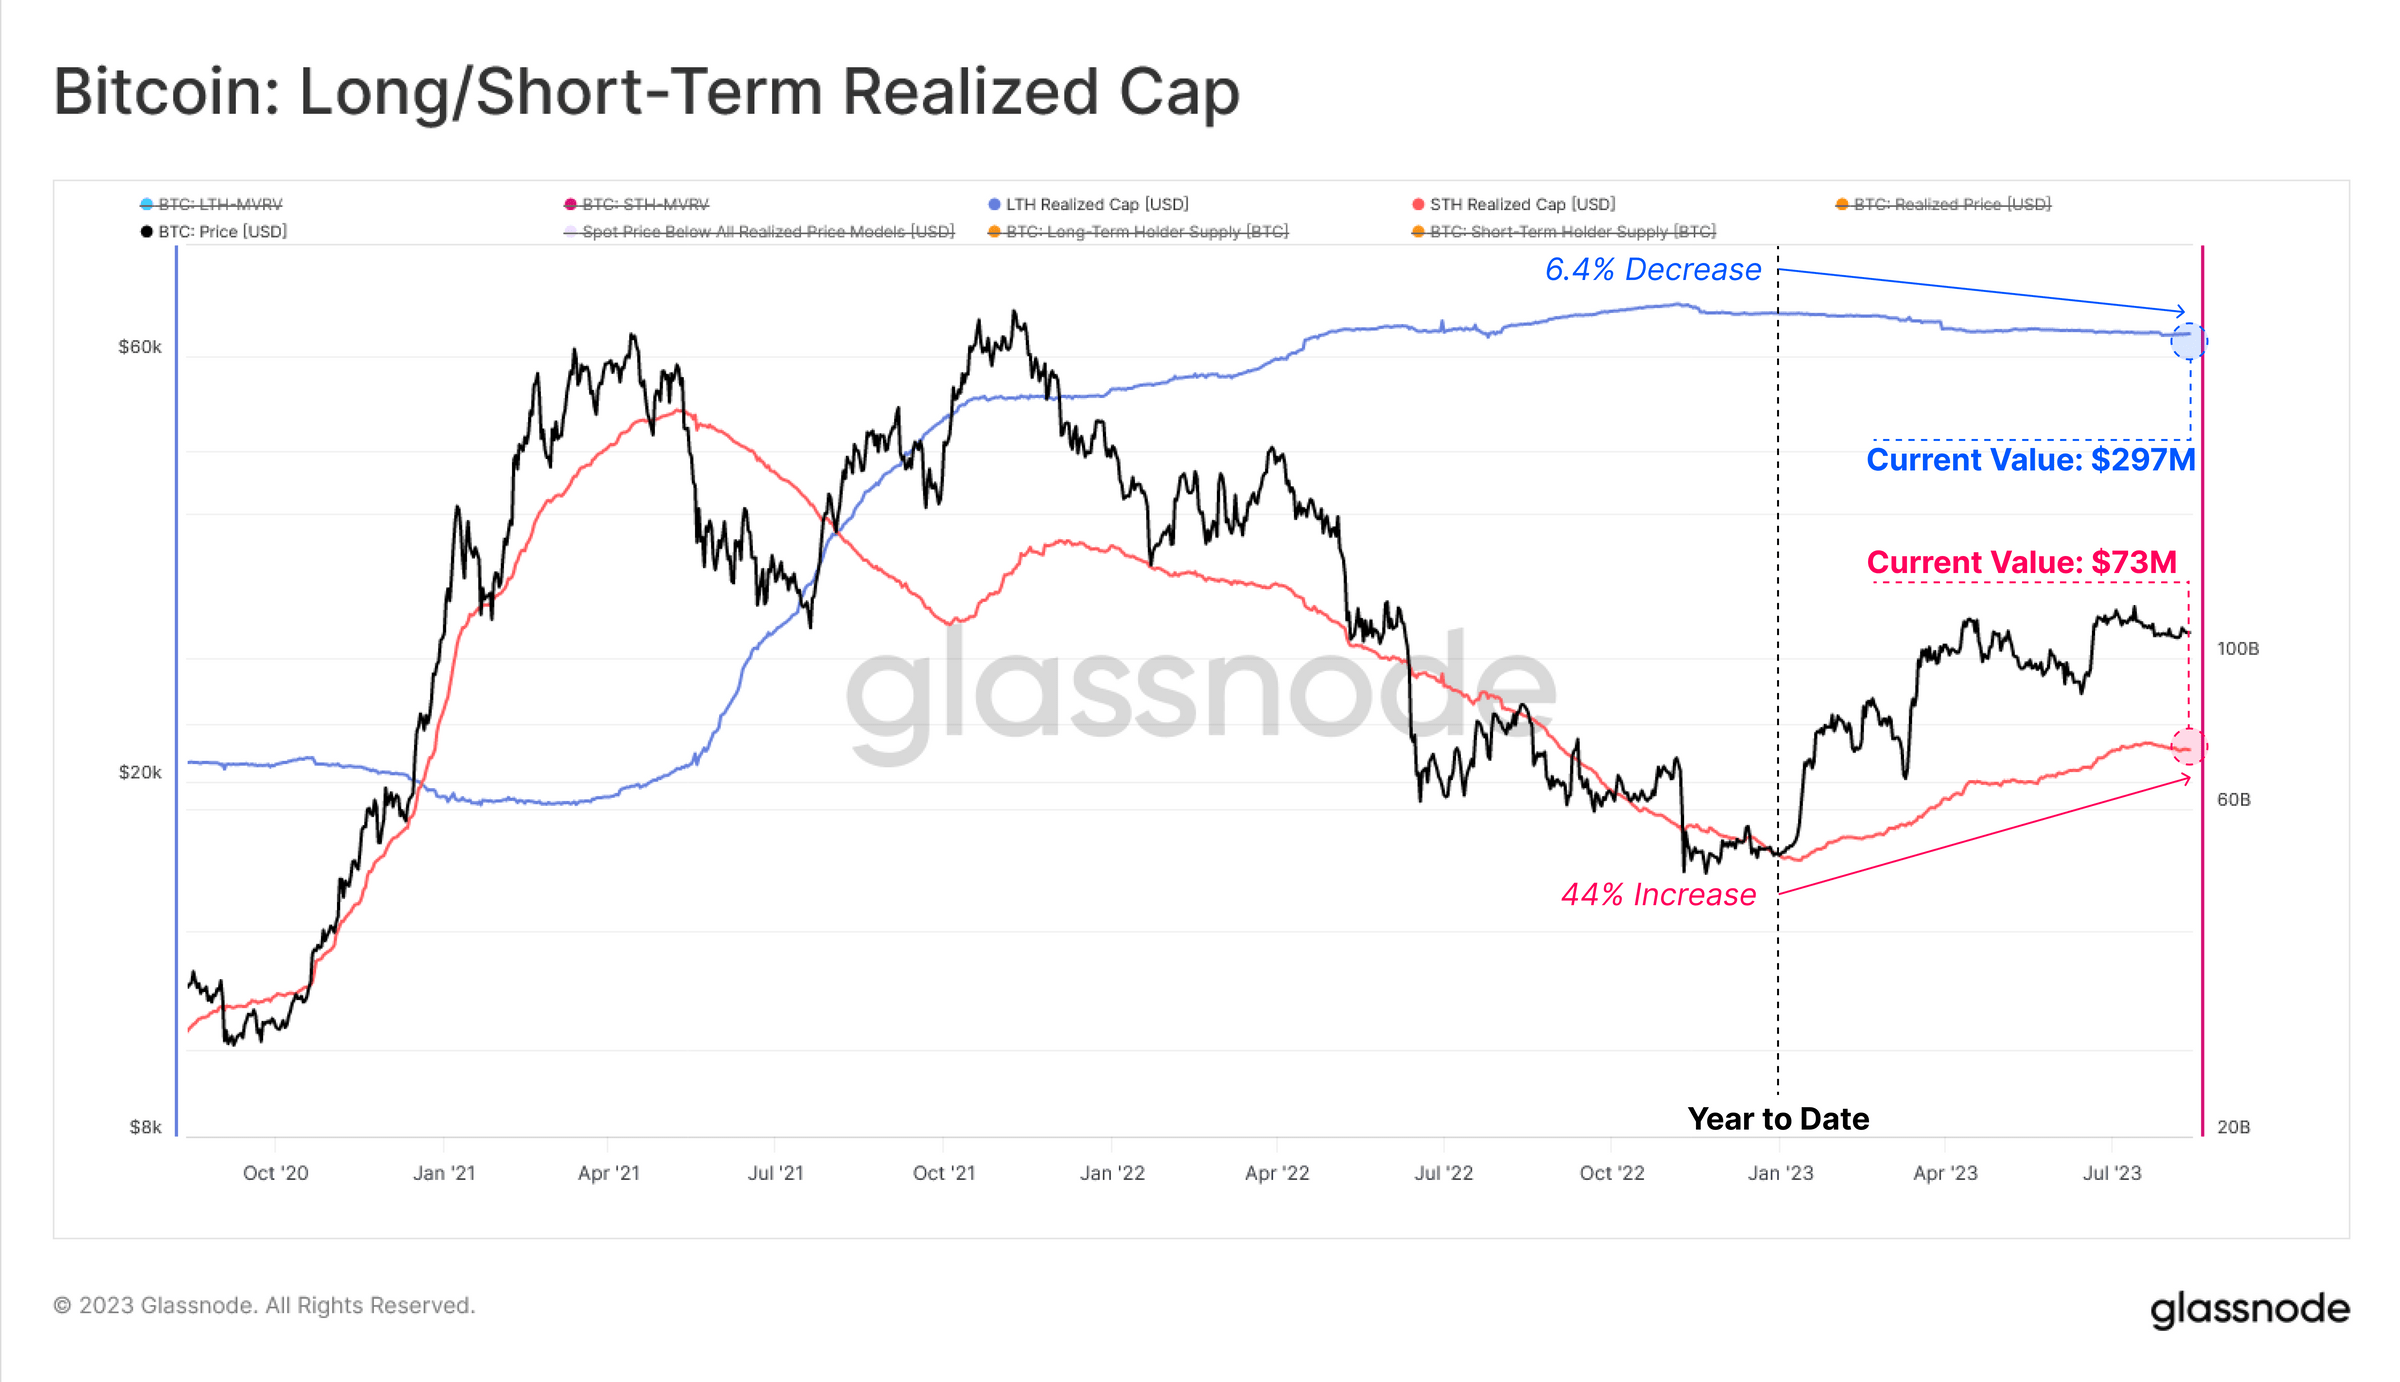
Meanwhile, the dynamics between short-term holders (STH) and long-term holders (LTH) offer a captivating narrative. Glassnode’s data indicates a significant shift in wealth between these two cohorts. The STH’s wealth has burgeoned by +$22B this year, while the LTH has witnessed a near-identical reduction of -$21B. This shift is not merely about numbers but also about market sentiment and strategy.
The cost basis further elucidates this dynamic. The STH cost basis has surged by +59% YTD, settling at $28.6k. In stark contrast, the LTH cost basis lingers considerably lower, around $20.3k. This divergence suggests that recent market entrants might be paying a premium, potentially due to FOMO (Fear of Missing Out) or speculative behavior.
Glassnode’s exploration into spending patterns in this low volatility environment is also particularly enlightening. The data suggests that in such periods, the majority of coins moved on-chain have a cost basis that hews closely to the spot rate, resulting in minuscule realized profits or losses.
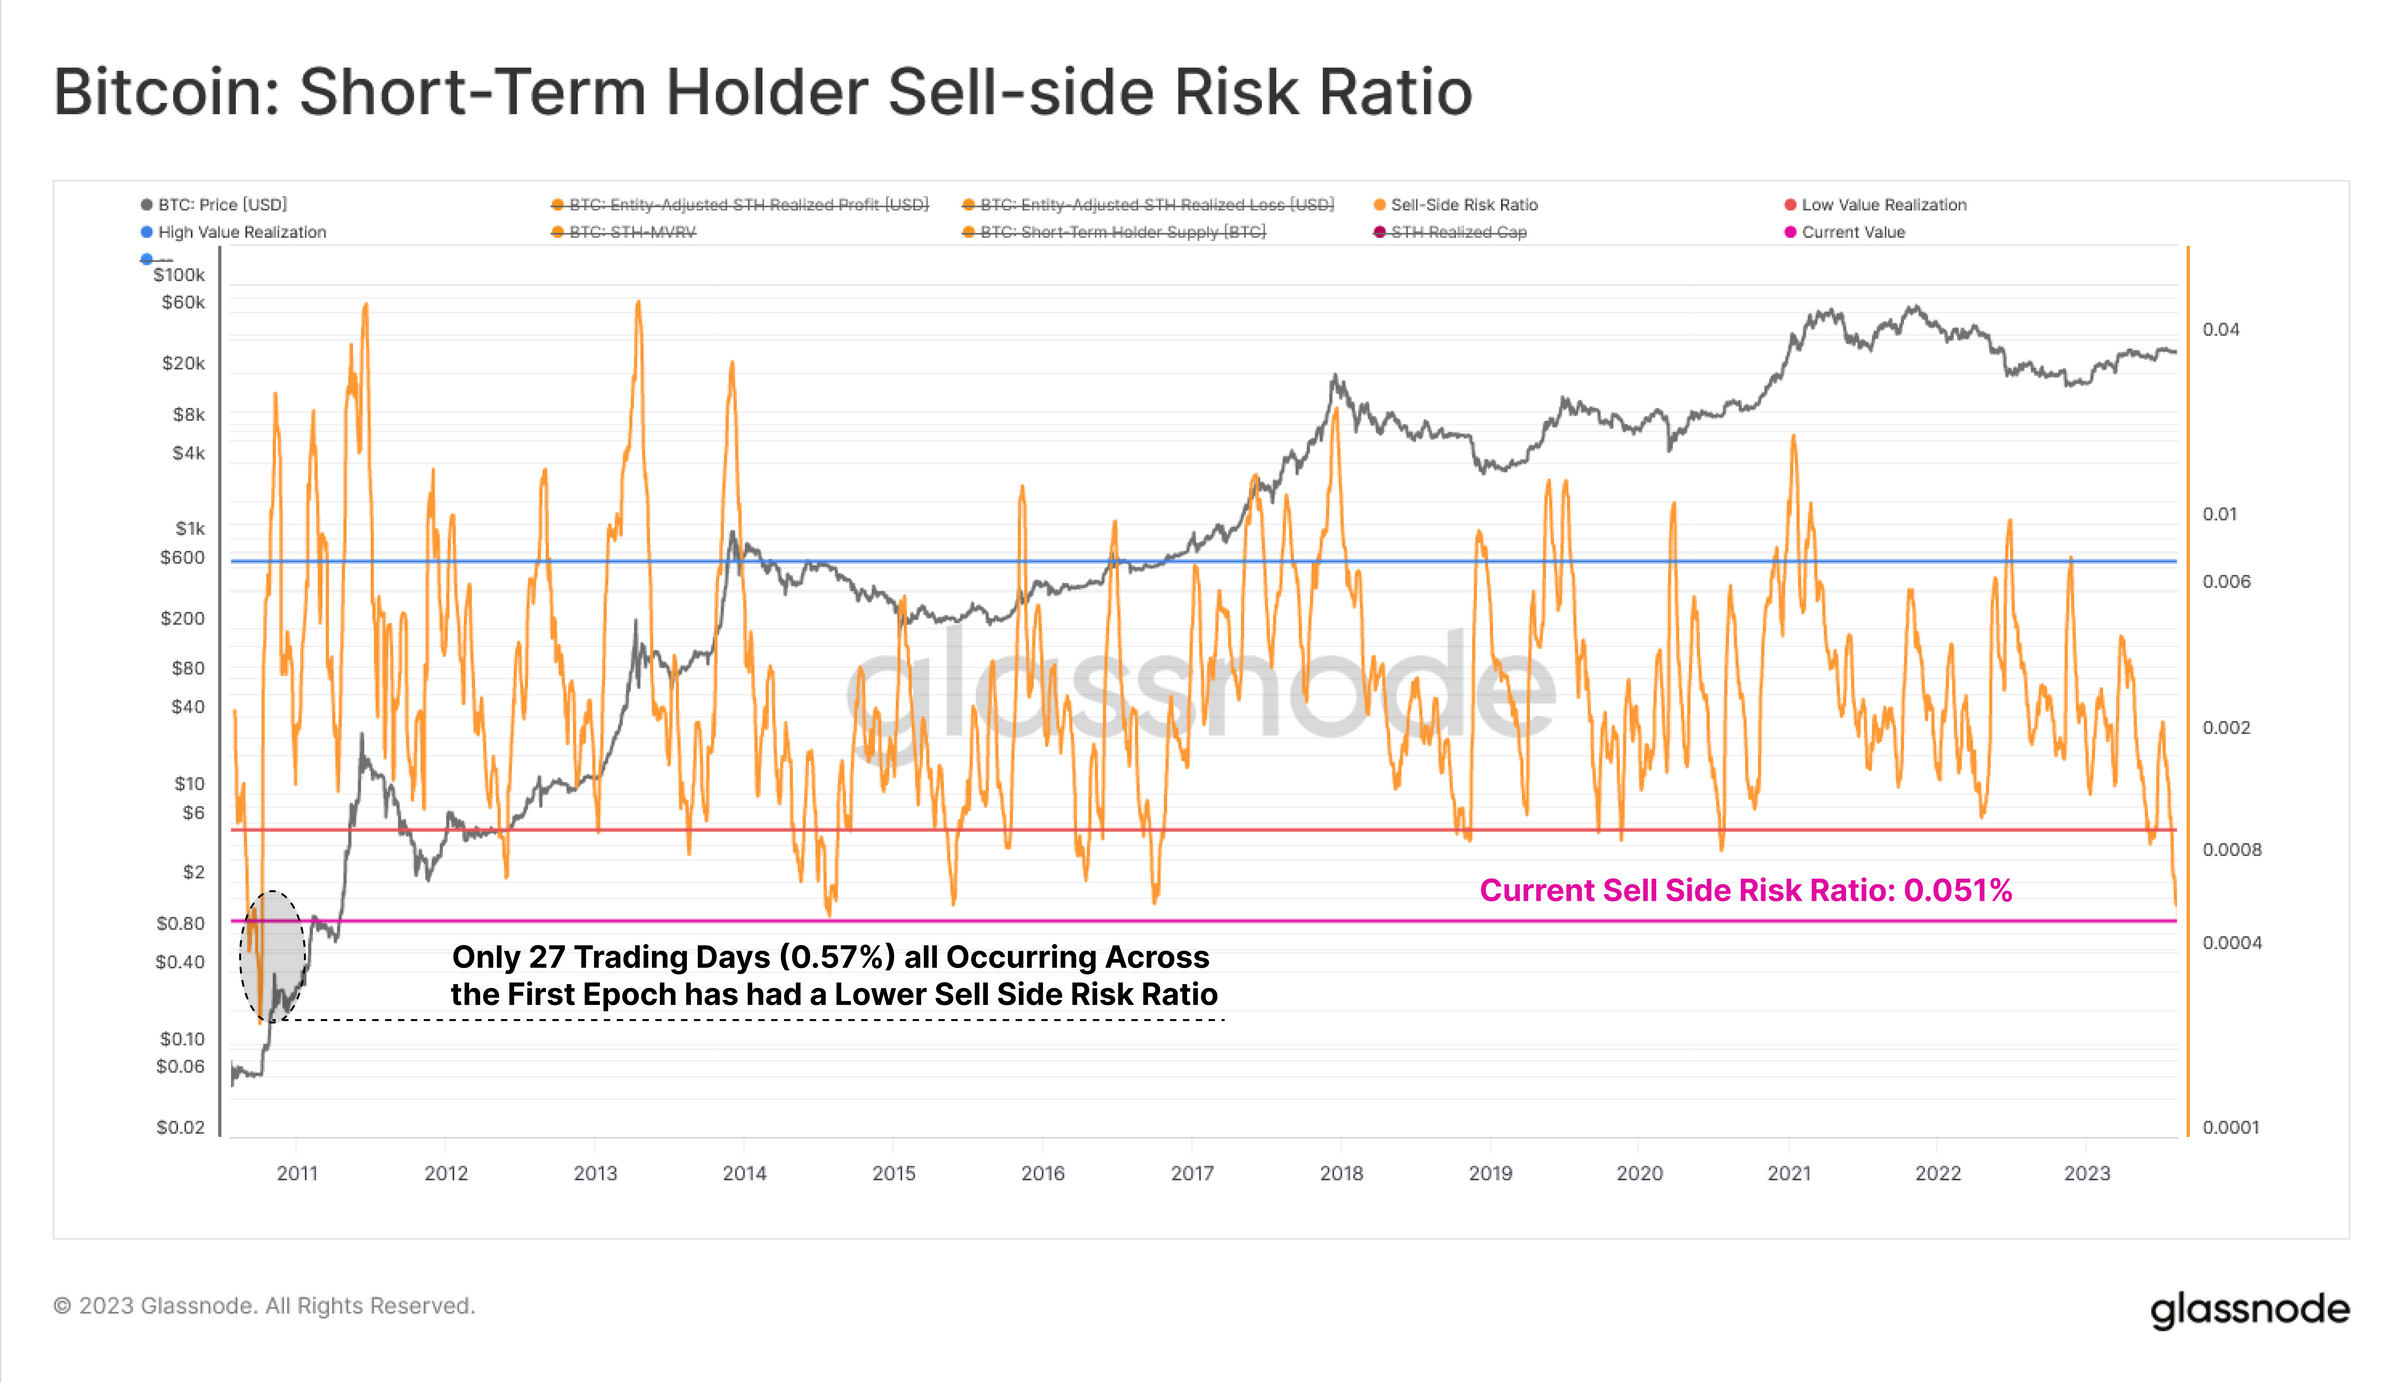
The Sell-Side Risk Ratio, a pivotal metric in this context, is languishing at an all-time low. To put it in perspective, fewer than 27 trading days (0.57%) have recorded a value lower than the current one, signaling a market teetering on the edge of a potential volatility resurgence.
Segmented View Of BTC’s Supply
The report’s segmented analysis of Bitcoin’s supply, based on ‘investor holding time,’ offers a layered understanding of market behavior. The ‘Hot Supply,’ representing the most active coins, constitutes a mere 2.8% of all invested value in BTC. This suggests a market dominated by holders rather than traders.
The ‘Warm Supply,’ spanning from a week to six months, has seen a modest uptick year-to-date, now accounting for around 30% of Bitcoin’s wealth. This segment’s behavior is crucial as it often acts as a bridge between short-term reactions and long-term convictions.
The ‘Single-Cycle Long-Term Holders,’ those entrenched in the 2020-23 cycle, are the behemoths, holding a staggering 63% of the invested capital. Their cost basis, as per Glassnode, stands at $33.8k, indicating an average unrealized loss of -13.3%.
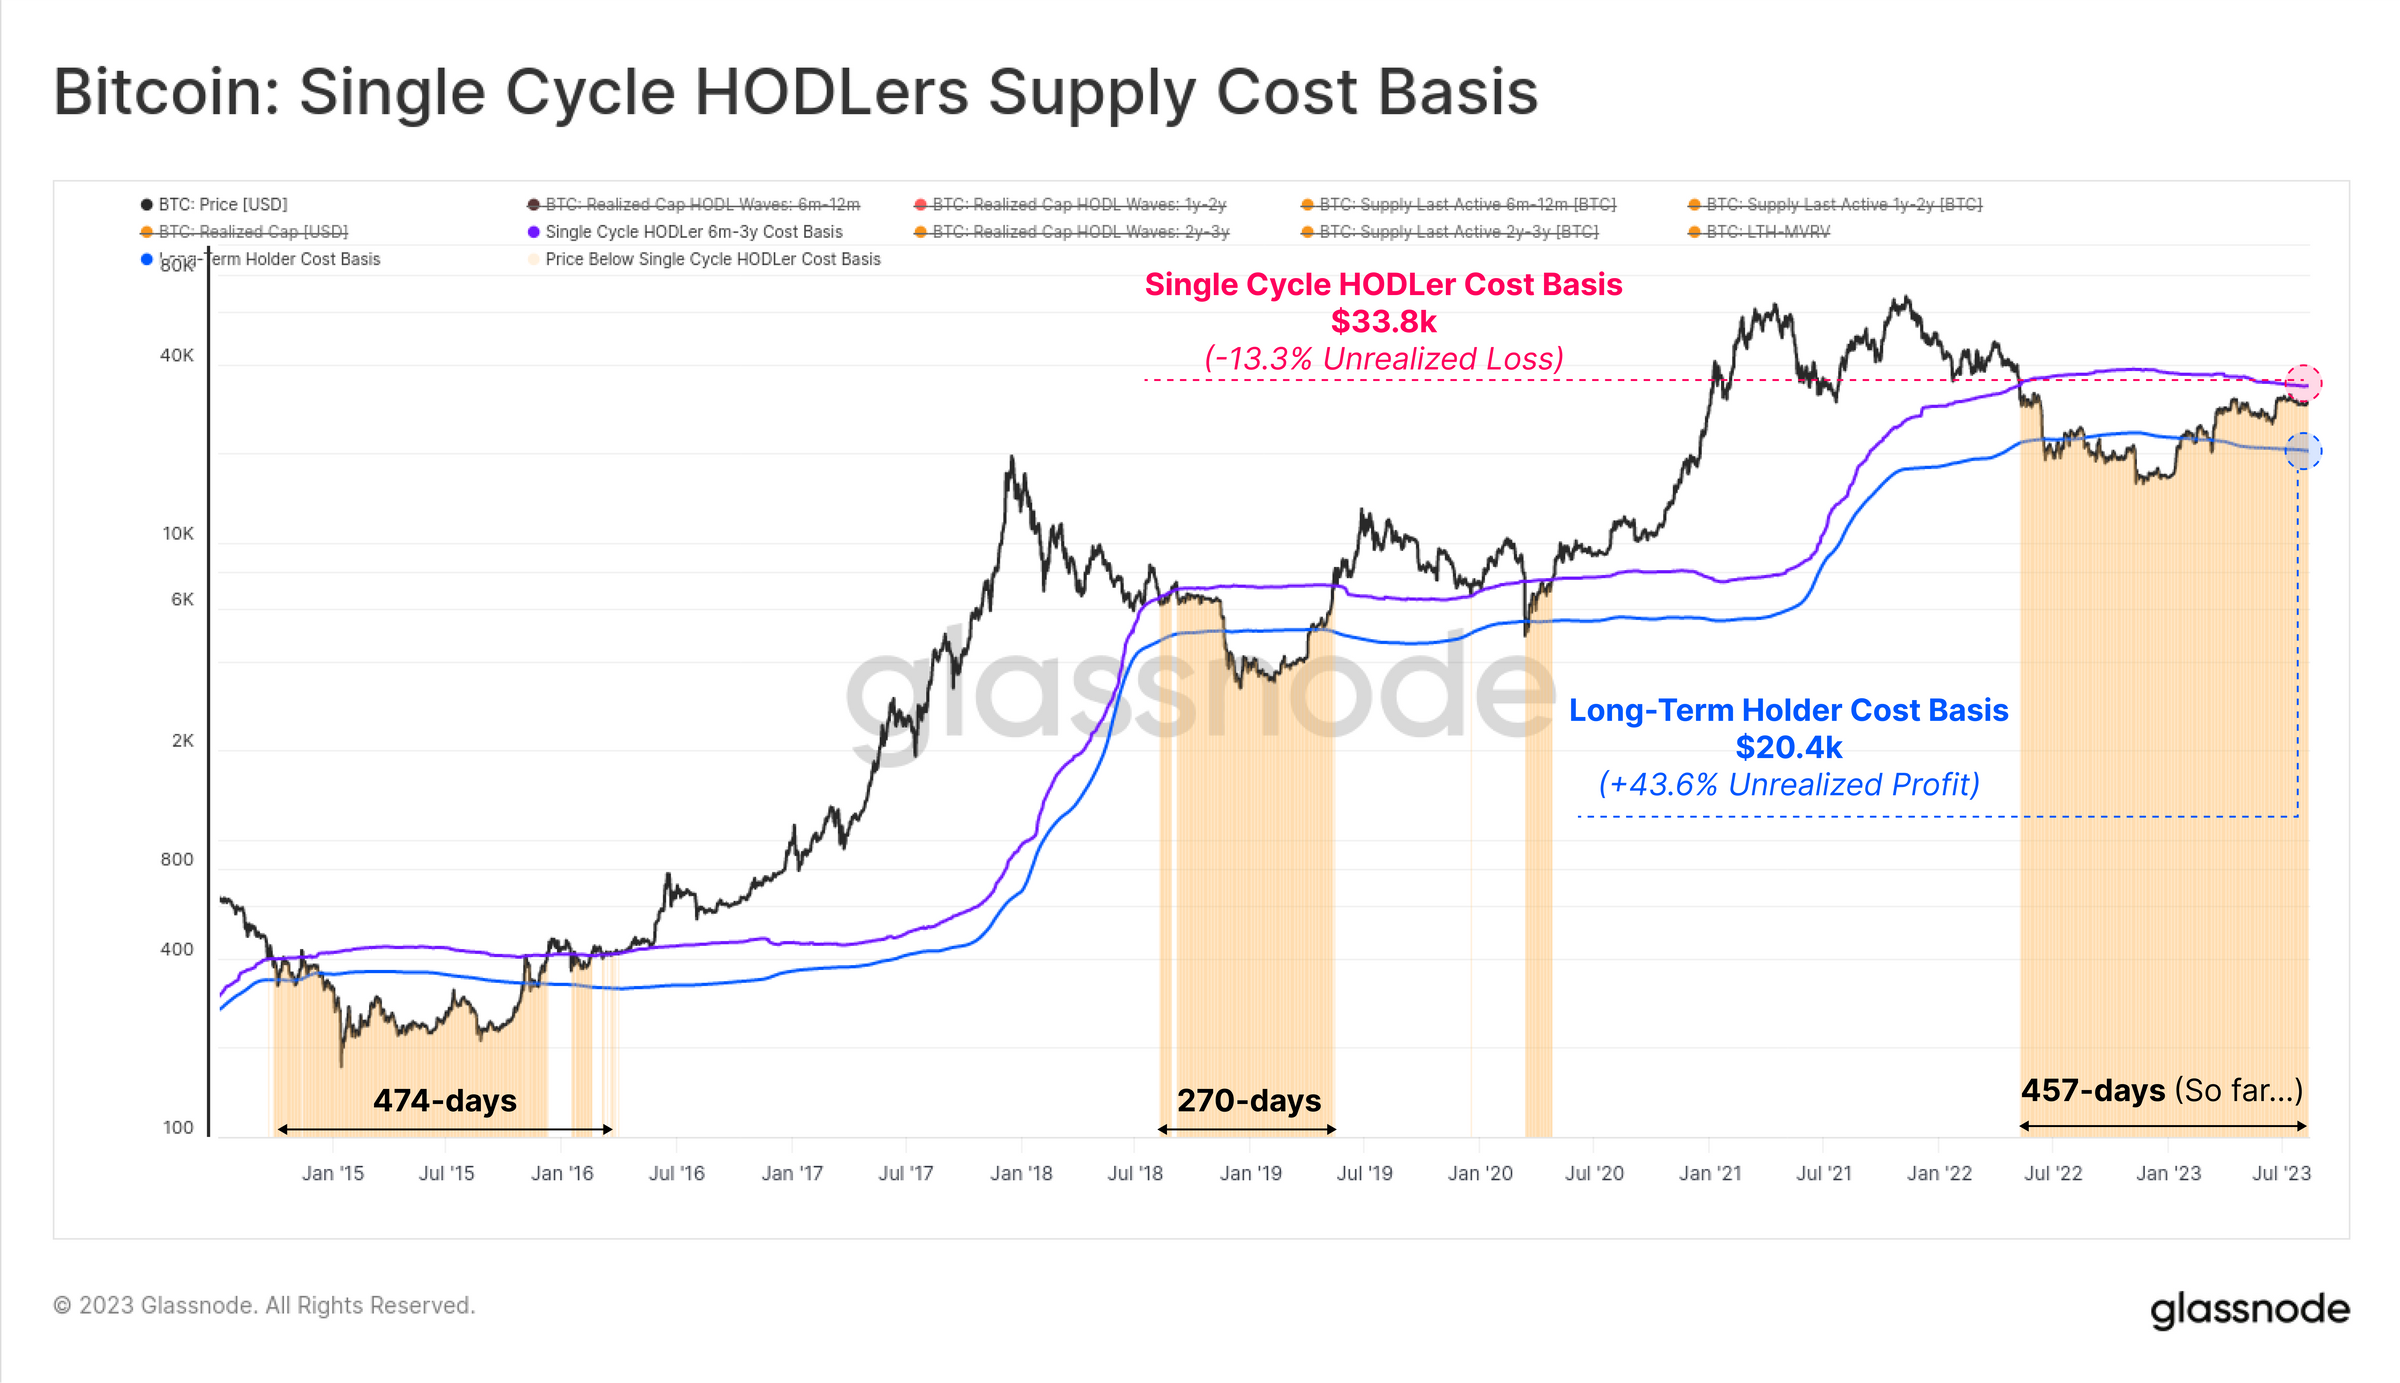
In juxtaposition, the classic LTH cohort, which includes the long-dormant and deep HODLed supply, boasts a cost basis of $20.4k, translating to an unrealized profit of +43.6%. This stark contrast underscores the lingering impact of the 2022 bear market and the cautious optimism of early adopters.
In conclusion, Glassnode’s data-driven insights paint a nuanced picture of the Bitcoin market. The dominance of long-term holders, the historic lows in volatility, and the evident investor apathy all converge to suggest a market in a state of stasis. The numbers indicate a market that’s waiting, perhaps for a Goldman Foresees Q2 2024 Fed Rate Cut: A Boost For Bitcoin? or a significant event, to determine its next direction.
At press time, Bitcoin was trading just above the 50-day EMA.
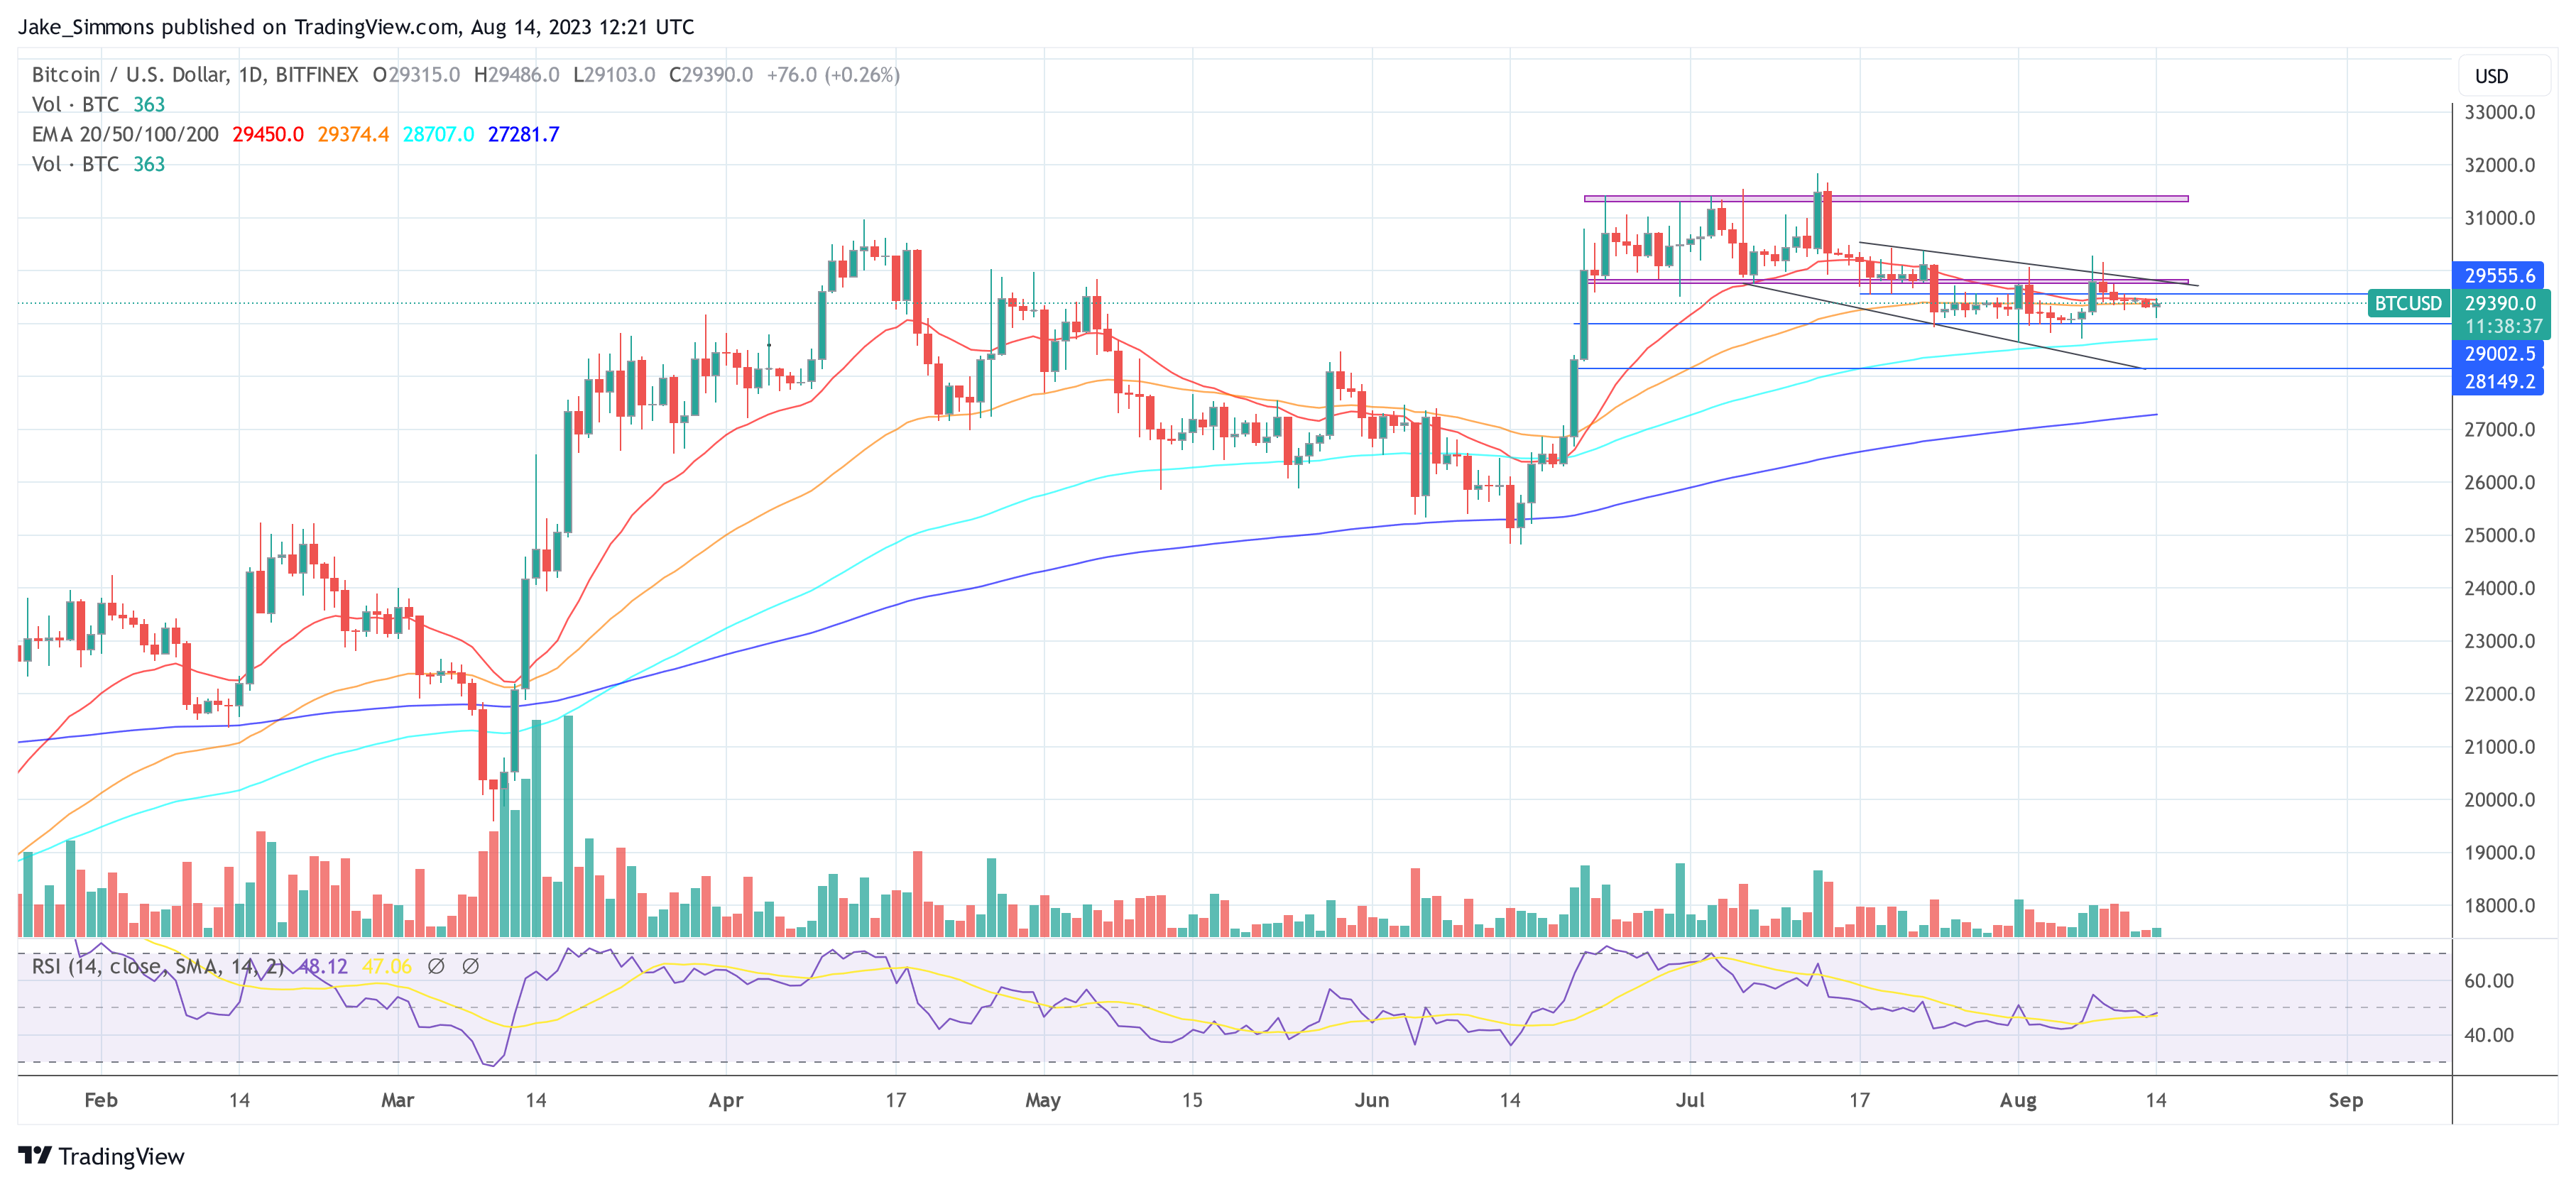
Featured image from iStock, chart from TradingView.com







