• Crypto
    • Bitcoin
    • Ethereum
    • Altcoins
    • Cardano
    • Solana
  • Web 3
    • Metaverse
    • NFT
  • Blockchain
  • Analysis
  • Learn
  • AI & VR
  • Gaming
  • Marketcap
  • Shop
What's Hot

Is Staking Crypto Safe? What You Should Know Before Staking

September 15, 2026

What Is the CLARITY Act and What Does It Mean for Crypto?

September 14, 2026

What Is Cross Margin in Crypto? How It Works, Risks, and Examples

September 14, 2026
Facebook Twitter Instagram
  • Contact
  • Disclosure
  • Privacy Policy
  • Terms & conditions
Facebook Twitter Instagram
VIP Crypto Signals
  • Crypto
    • Bitcoin
    • Ethereum
    • Altcoins
    • Cardano
    • Solana
  • Web 3
    • Metaverse
    • NFT
  • Blockchain
  • Analysis
  • Learn
  • AI & VR
  • Gaming
  • Marketcap
  • Shop
VIP Crypto Signals
Home » Blog » Solana (SOL) Price Yearly High Confirms Trend Reversal
Solana

Solana (SOL) Price Yearly High Confirms Trend Reversal

July 14, 2023No Comments3 Mins Read
Share
Facebook Twitter LinkedIn Pinterest Email

The Solana (SOL) price broke out from long-term diagonal and horizontal resistance levels. The price has likely begun a new bullish trend reversal.

The price action and indicators support the continuing increase, making it likely that the SOL price will continue increasing in the near future.

Solana Price Resumes Ascent After Long-Term Breakout

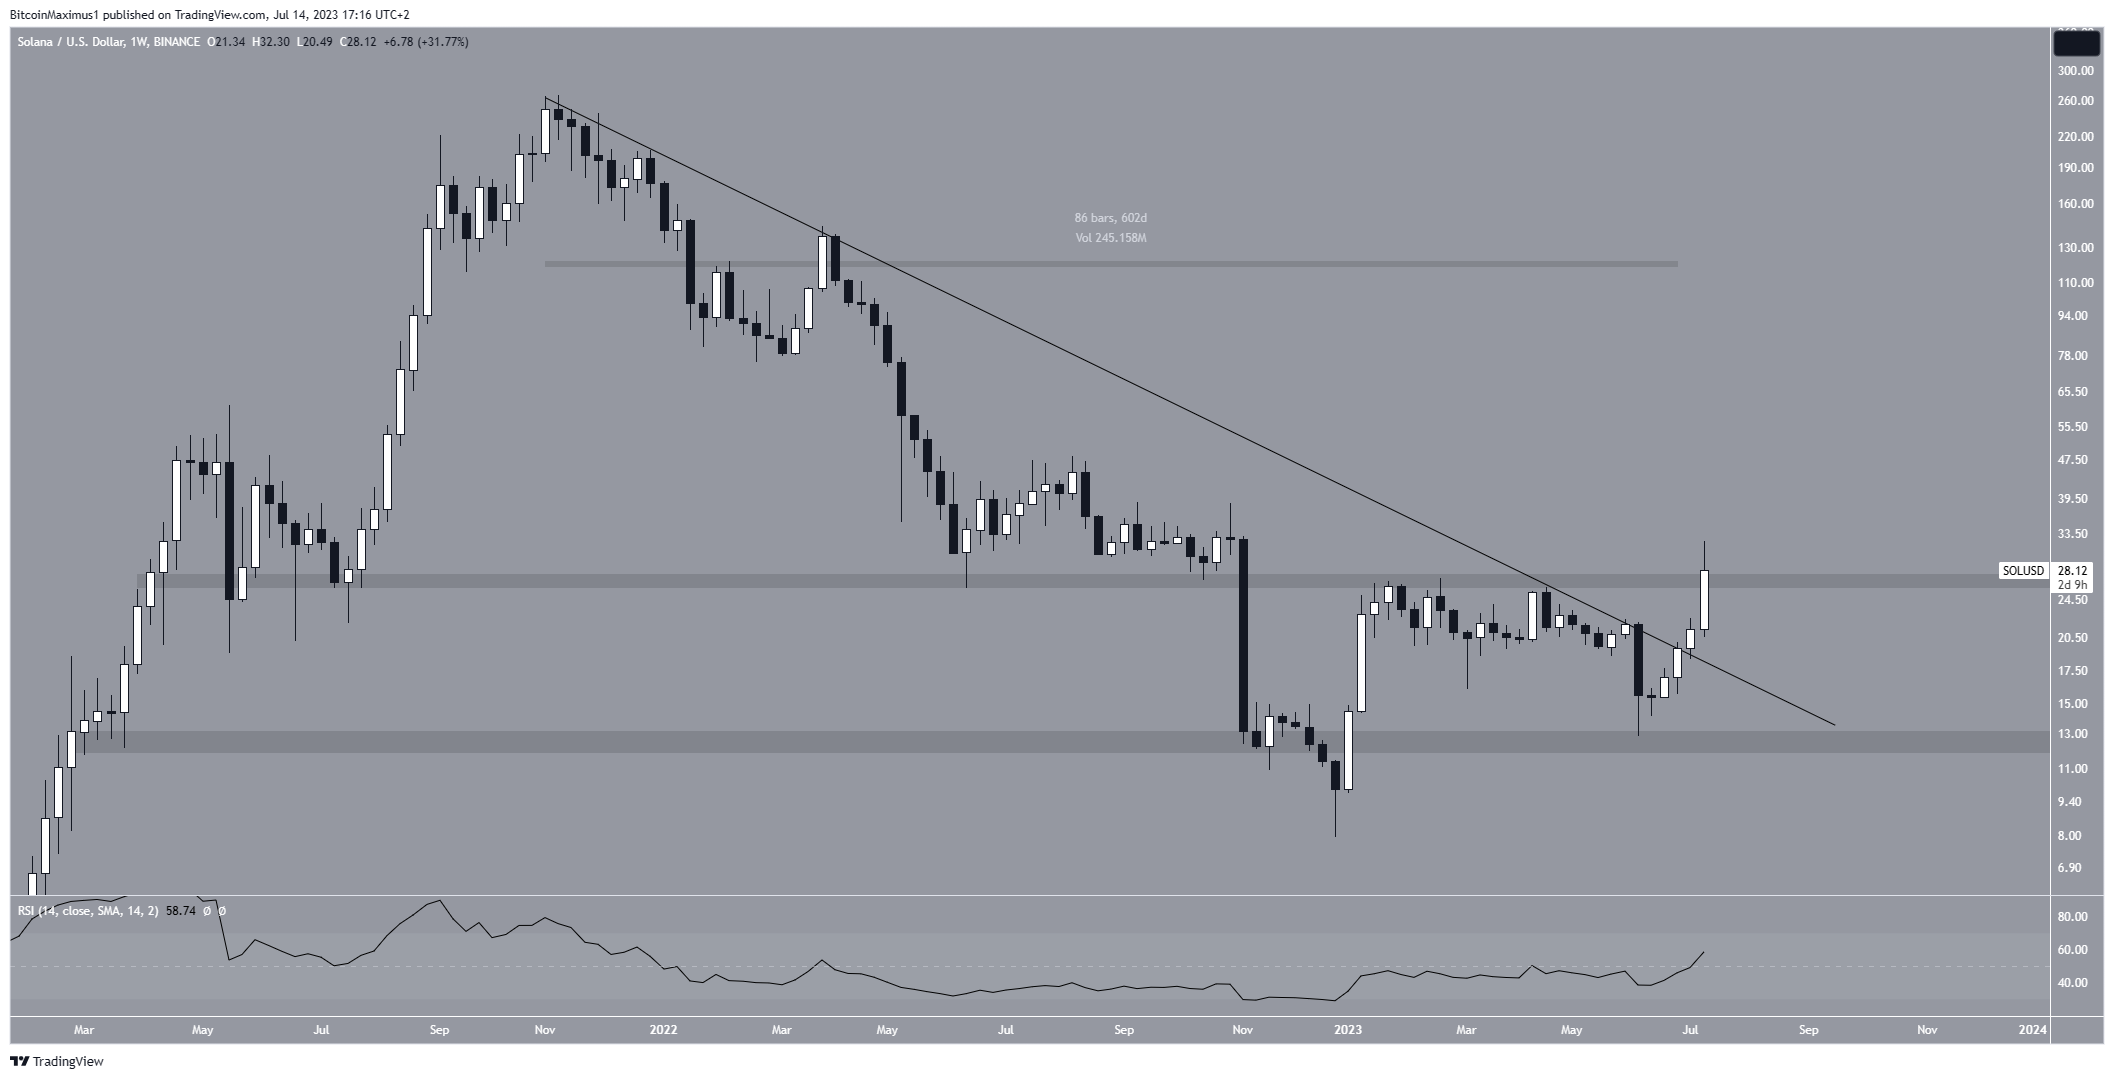
When examining the weekly time frame, it is evident that SOL experienced a breakout last week by surpassing a long-standing descending resistance line. This line has been present since November 2021, lasting for a span of 600 days.

Such breakouts from extended structures often indicate the conclusion of the previous trend and the commencement of a new one in the opposite direction.

In the case of SOL, the price has probably initiated a bullish trend reversal. The bullish candlestick this week further strengthens this possibility. The price now trades inside the long-term $28 horizontal resistance area.

SOL/USD Weekly Chart. Source: TradingView

Although the breakout is supported by the daily Relative Strength Index (RSI), it has yet to be confirmed. Traders commonly utilize the RSI as a momentum indicator to determine if a market is either overbought or oversold, assisting them in deciding whether to accumulate or sell an asset.

The RSI has shown a higher low and is currently above 50. However, there are two more days until the weekly close, so it remains to be seen if the RSI closes above this area.

SOL Price Prediction: Is $40 on the Cards?

The technical analysis of the daily timeframe shows a 120% increase since June 10. During this increase, the SOL price broke out from a descending resistance line that had been in place since April 17. This successful breakthrough confirmed a bullish trend, particularly in the short term.

See also  ADA Price Prediction – Here’s Why Cardano Could Dump To $0.50

Furthermore, the daily RSI is currently above 50 and is increasing, providing further support for the validity of the breakout.

On July 14, the SOL reached a new yearly high of $32.13. The high was above the $26 resistance area, which is now expected to provide support. If the increase continues, the next resistance will be at $38.

Solana (SOL) Price Daily Movement
SOL/USDT Daily Chart. Source: TradingView

Despite this bullish SOL price prediction, a close below $26 could catalyze a sharp fall to $20. However, there are no signs that suggest this will occur.

For BeInCrypto’s latest crypto market analysis, click here

Disclaimer

In line with the Trust Project guidelines, this price analysis article is for informational purposes only and should not be considered financial or investment advice. BeInCrypto is committed to accurate, unbiased reporting, but market conditions are subject to change without notice. Always conduct your own research and consult with a professional before making any financial decisions.

Source link

confirms High Price reversal SOL Solana trend Yearly
Share. Facebook Twitter Pinterest LinkedIn Tumblr Email

Related Posts

What Is Bitcoin Halving & How Does It Affect BTC Price?

September 1, 2026

Bitcoin Just Hit an All-Time High. Nobody Cares

July 20, 2026

Best Solana Memecoins to Buy in 2026

June 6, 2026

Crypto Reversal Patterns: How to Spot Bullish & Bearish Trend Reversals

May 26, 2026
Add A Comment

Leave A Reply Cancel Reply

Top Posts

Is Staking Crypto Safe? What You Should Know Before Staking

September 15, 2026

What Is the CLARITY Act and What Does It Mean for Crypto?

September 14, 2026

What Is Cross Margin in Crypto? How It Works, Risks, and Examples

September 14, 2026

Subscribe to Updates

Get the latest news and Update from VIP Crypto Signals about Crypto, Web3, Metaverse, NFT and more.

Our mission is to develop a community of people who try to make financially sound decisions. The website strives to educate individuals in making wise choices about Cryptocurrencies, NFT, Metaverse and more.

We're social. Connect with us:

Facebook Twitter Instagram Pinterest YouTube
Top Insights

Is Staking Crypto Safe? What You Should Know Before Staking

September 15, 2026

What Is the CLARITY Act and What Does It Mean for Crypto?

September 14, 2026

What Is Cross Margin in Crypto? How It Works, Risks, and Examples

September 14, 2026
Get Informed

Subscribe to Updates

Get the latest news and Update from VIP Crypto Signals about Crypto, Web3, Metaverse, NFT and more.

Facebook Twitter Instagram Pinterest
  • Contact
  • Disclosure
  • Privacy Policy
  • Terms & conditions
© 2026 Vip Crypto Signals - All rights reserved.

Type above and press Enter to search. Press Esc to cancel.

  • FibSwap DEXFibSwap DEX(FIBO)$0.0084659.90%
  • bitcoinBitcoin(BTC)$70,953.006.13%
  • ethereumEthereum(ETH)$3,664.5818.50%
  • tetherTether(USDT)$1.00-0.01%
  • binancecoinBNB(BNB)$627.698.99%
  • solanaSolana(SOL)$181.131.69%
  • staked-etherLido Staked Ether(STETH)$3,662.5418.48%
  • usd-coinUSDC(USDC)$1.00-0.02%
  • rippleXRP(XRP)$0.545.05%
  • dogecoinDogecoin(DOGE)$0.1634778.14%

