• Crypto
    • Bitcoin
    • Ethereum
    • Altcoins
    • Cardano
    • Solana
  • Web 3
    • Metaverse
    • NFT
  • Blockchain
  • Analysis
  • Learn
  • AI & VR
  • Gaming
  • Marketcap
  • Shop
What's Hot

Is Staking Crypto Safe? What You Should Know Before Staking

September 15, 2026

What Is the CLARITY Act and What Does It Mean for Crypto?

September 14, 2026

What Is Cross Margin in Crypto? How It Works, Risks, and Examples

September 14, 2026
Facebook Twitter Instagram
  • Contact
  • Disclosure
  • Privacy Policy
  • Terms & conditions
Facebook Twitter Instagram
VIP Crypto Signals
  • Crypto
    • Bitcoin
    • Ethereum
    • Altcoins
    • Cardano
    • Solana
  • Web 3
    • Metaverse
    • NFT
  • Blockchain
  • Analysis
  • Learn
  • AI & VR
  • Gaming
  • Marketcap
  • Shop
VIP Crypto Signals
Home » Blog » Stellar’s XLM surges by 22% in a week – Will the uptrend continue?
Altcoins

Stellar’s XLM surges by 22% in a week – Will the uptrend continue?

July 23, 2023No Comments3 Mins Read
Share
Facebook Twitter LinkedIn Pinterest Email


  • In the last week, XLM’s price grew by double digits.
  • With changing sentiments, a price retraction might occur this week. 

Posting double-digit gains of almost 25% in the last seven days, Stellar Lumens [XLM] ranked as the second crypto asset with the highest price growth in the last week, according to data from CoinMarketCap.


Read Stellar Lumens’ [XLM] Price Prediction 2023-24


In the last month, XLM’s value rallied by 78%. This occurred despite sharing a statistically significant positive correlation with leading Bitcoin [BTC], whose price remained stagnated during the same period. 

Gains abound, but there is a catch

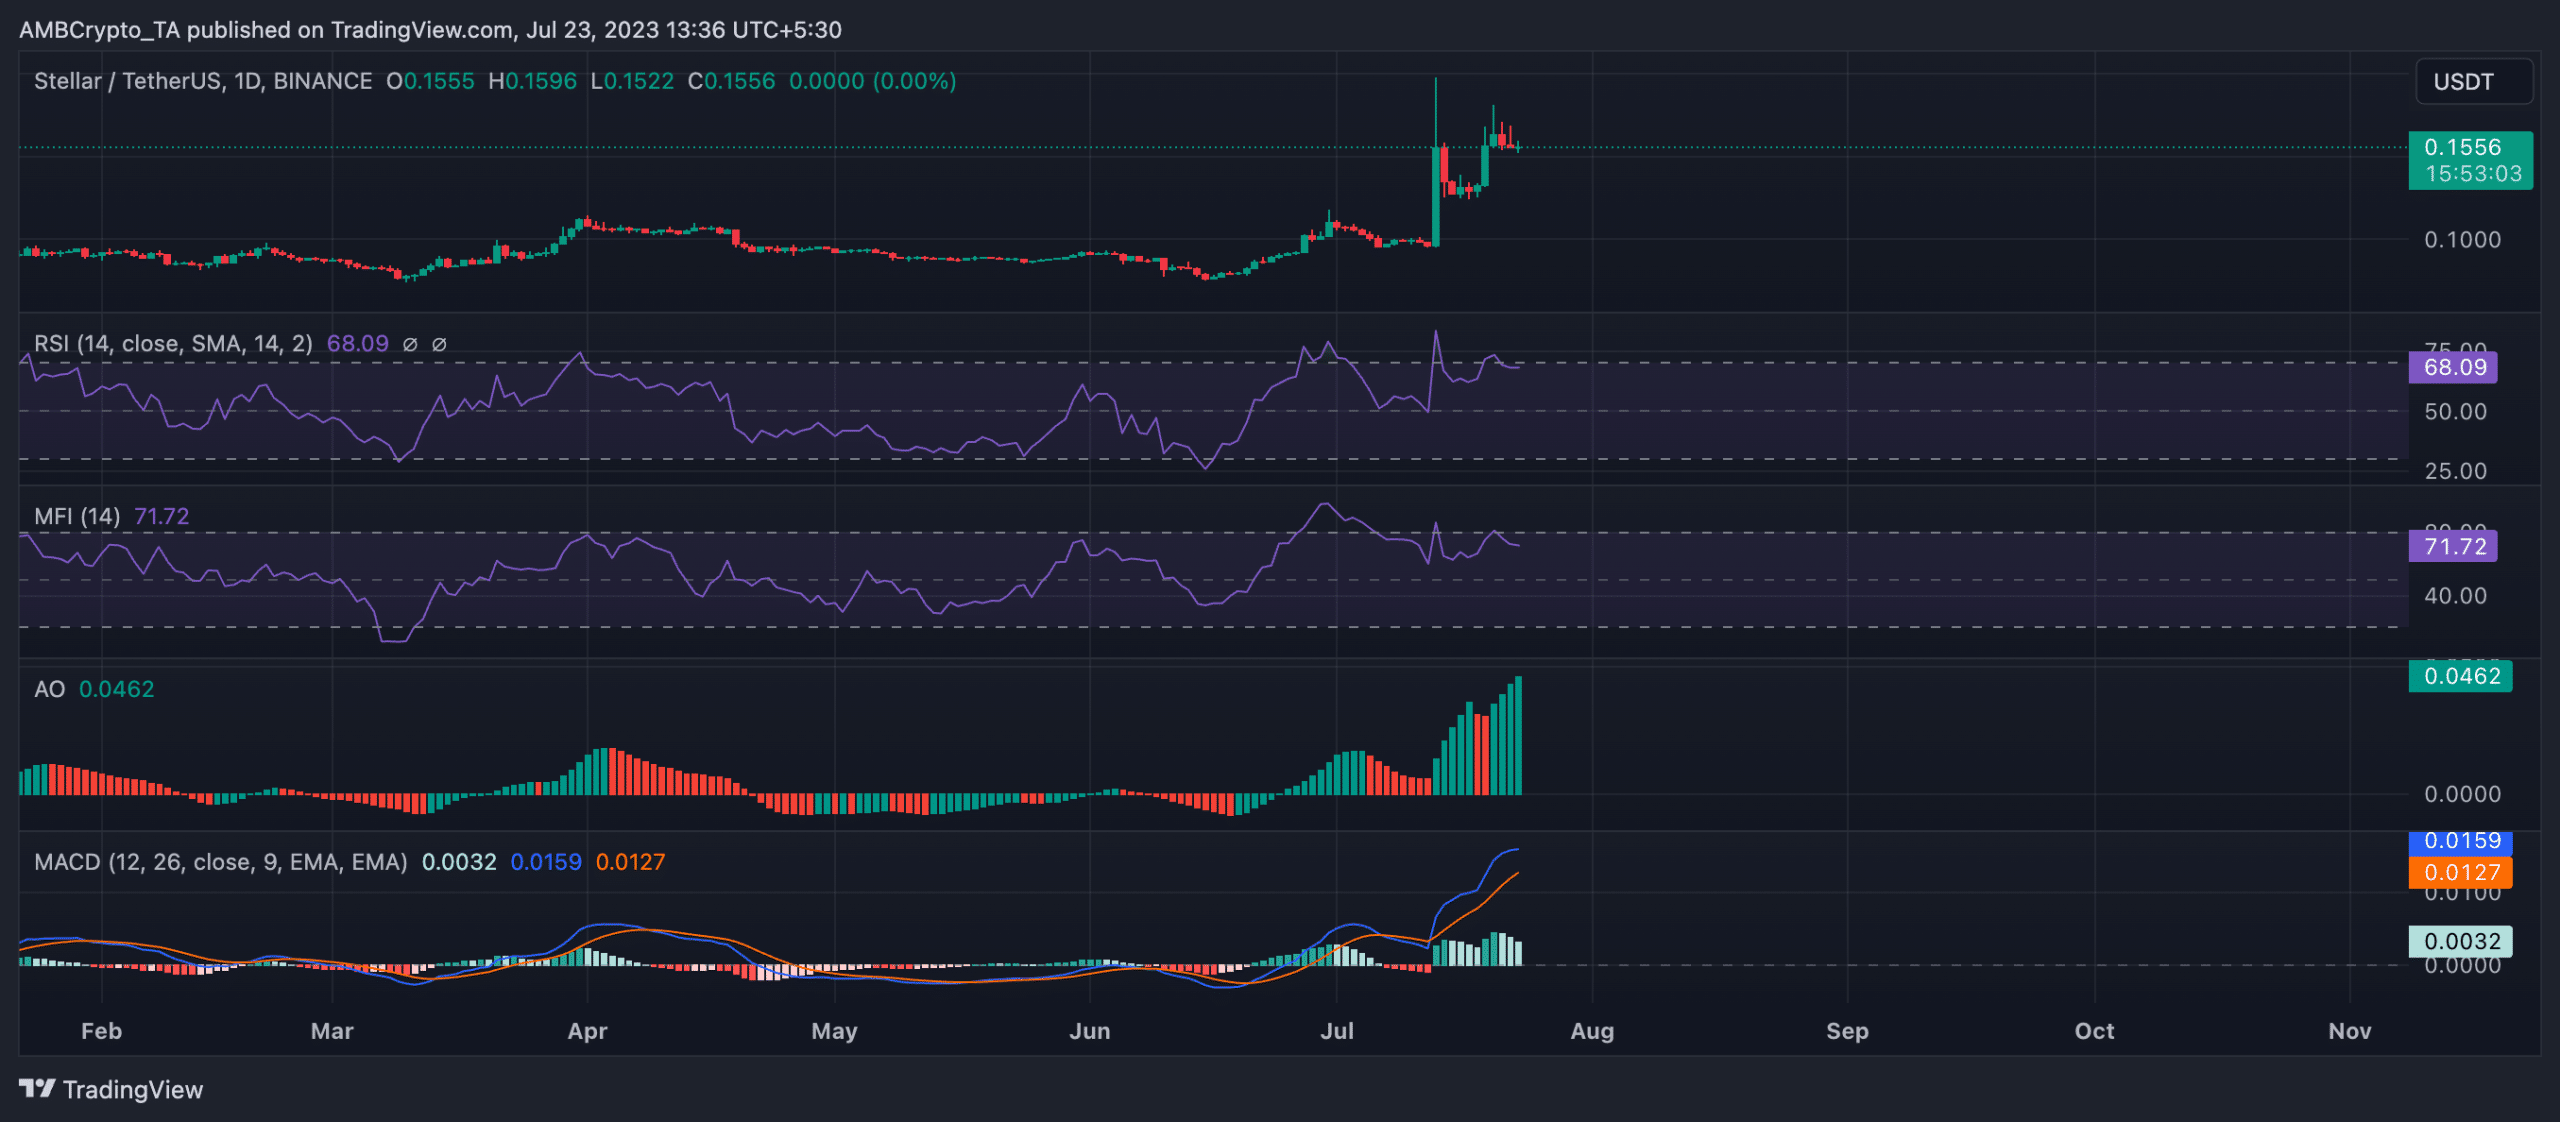
At press time, Stellar’s native token exchanged hands at $0.155. The token commenced a new bull cycle on 12 July, when the MACD line intersected the trend line in an upward direction. This crossover signaled the shift in momentum from bearish to bullish and confirmed the continuation of the existing price uptrend. XLM’s value has since gone up by 67%.

Also, a look at the alt’s Awesome Oscillator (AO) indicator revealed that trades since mid-July have been represented mainly by tall green histogram bars that have rested above the zero line. When an asset’s AO returns bars that sit above the zero line, this suggests that short-term momentum is greater than long-term momentum, indicating bullish momentum.

Further key momentum indicators Relative Strength Index (RSI) and Money Flow Index (MFI), were positioned above their respective center lines at press time and have been in the past few weeks. With these indicators still maintaining an upward trajectory, XLM accumulation has climbed since the commencement of the bull run, hence, the continued price growth. 

Source: XLM/USDT on TradingView

An on-chain review of the token’s Open Interest confirmed this has also grown. When an asset’s Open Interest surges, it indicates a substantial increase in the number of open positions in the market. With an accompanying price rally, the growth in Open Interest signaled a rise in trade positions being opened by XLM traders.

Source: Coinglass

XLM sails muddy waters

A closer look at XLM’s performance on-chain revealed that the new week might be plagued by a price retracement. Firstly, weighted sentiment tumbled and flipped into negative territory two days ago. As of this writing, the metric remained below zero at -0.56. This suggests that investors were beginning to lose faith in any further price growth. 

XLM weighted sentiment

Source: Santiment

While Open Interest climbed, an assessment of XLM’s funding rates across exchanges revealed an uptick in the number of short positions opened against XLM. While short traders have logged losses due to XLM’s price growth, they remain fervent in placing bets against XLM.

XLM Funding rates

Source: Coinglass


How much are 1,10,100 XLMs worth today?

See also  MATIC's Surge Powers Through Resistance With 4% Uptrend

In addition, on a D1 chart, XLM’s price traded dangerously close to the upper band of its Bollinger Bands indicator. This signaled that the alt might be overbought. And that a price correction lurked on the horizon. 

Lastly, despite the growth in price, its Chaikin Money Flow trended downwards. This created a bearish divergence that is often taken as a sell signal by traders.

Source: XLM/USDT on TradingView

Source link

Continue Stellars surges uptrend Week XLM
Share. Facebook Twitter Pinterest LinkedIn Tumblr Email

Related Posts

All Eyes on Art: Upcoming Collections to Watch the Week of May 27

July 19, 2026

All Eyes on Art: Upcoming Collections to Watch the Week of June 3

July 19, 2026

All Eyes on Art: Upcoming Collections to Watch the Week of June 10

July 19, 2026

Top 5 IDO Projects to Keep an Eye on This Week | Latest Crypto Launches

December 8, 2025
Add A Comment

Leave A Reply Cancel Reply

Top Posts

Is Staking Crypto Safe? What You Should Know Before Staking

September 15, 2026

What Is the CLARITY Act and What Does It Mean for Crypto?

September 14, 2026

What Is Cross Margin in Crypto? How It Works, Risks, and Examples

September 14, 2026

Subscribe to Updates

Get the latest news and Update from VIP Crypto Signals about Crypto, Web3, Metaverse, NFT and more.

Our mission is to develop a community of people who try to make financially sound decisions. The website strives to educate individuals in making wise choices about Cryptocurrencies, NFT, Metaverse and more.

We're social. Connect with us:

Facebook Twitter Instagram Pinterest YouTube
Top Insights

Is Staking Crypto Safe? What You Should Know Before Staking

September 15, 2026

What Is the CLARITY Act and What Does It Mean for Crypto?

September 14, 2026

What Is Cross Margin in Crypto? How It Works, Risks, and Examples

September 14, 2026
Get Informed

Subscribe to Updates

Get the latest news and Update from VIP Crypto Signals about Crypto, Web3, Metaverse, NFT and more.

Facebook Twitter Instagram Pinterest
  • Contact
  • Disclosure
  • Privacy Policy
  • Terms & conditions
© 2026 Vip Crypto Signals - All rights reserved.

Type above and press Enter to search. Press Esc to cancel.

  • FibSwap DEXFibSwap DEX(FIBO)$0.0084659.90%
  • bitcoinBitcoin(BTC)$70,953.006.13%
  • ethereumEthereum(ETH)$3,664.5818.50%
  • tetherTether(USDT)$1.00-0.01%
  • binancecoinBNB(BNB)$627.698.99%
  • solanaSolana(SOL)$181.131.69%
  • staked-etherLido Staked Ether(STETH)$3,662.5418.48%
  • usd-coinUSDC(USDC)$1.00-0.02%
  • rippleXRP(XRP)$0.545.05%
  • dogecoinDogecoin(DOGE)$0.1634778.14%

