
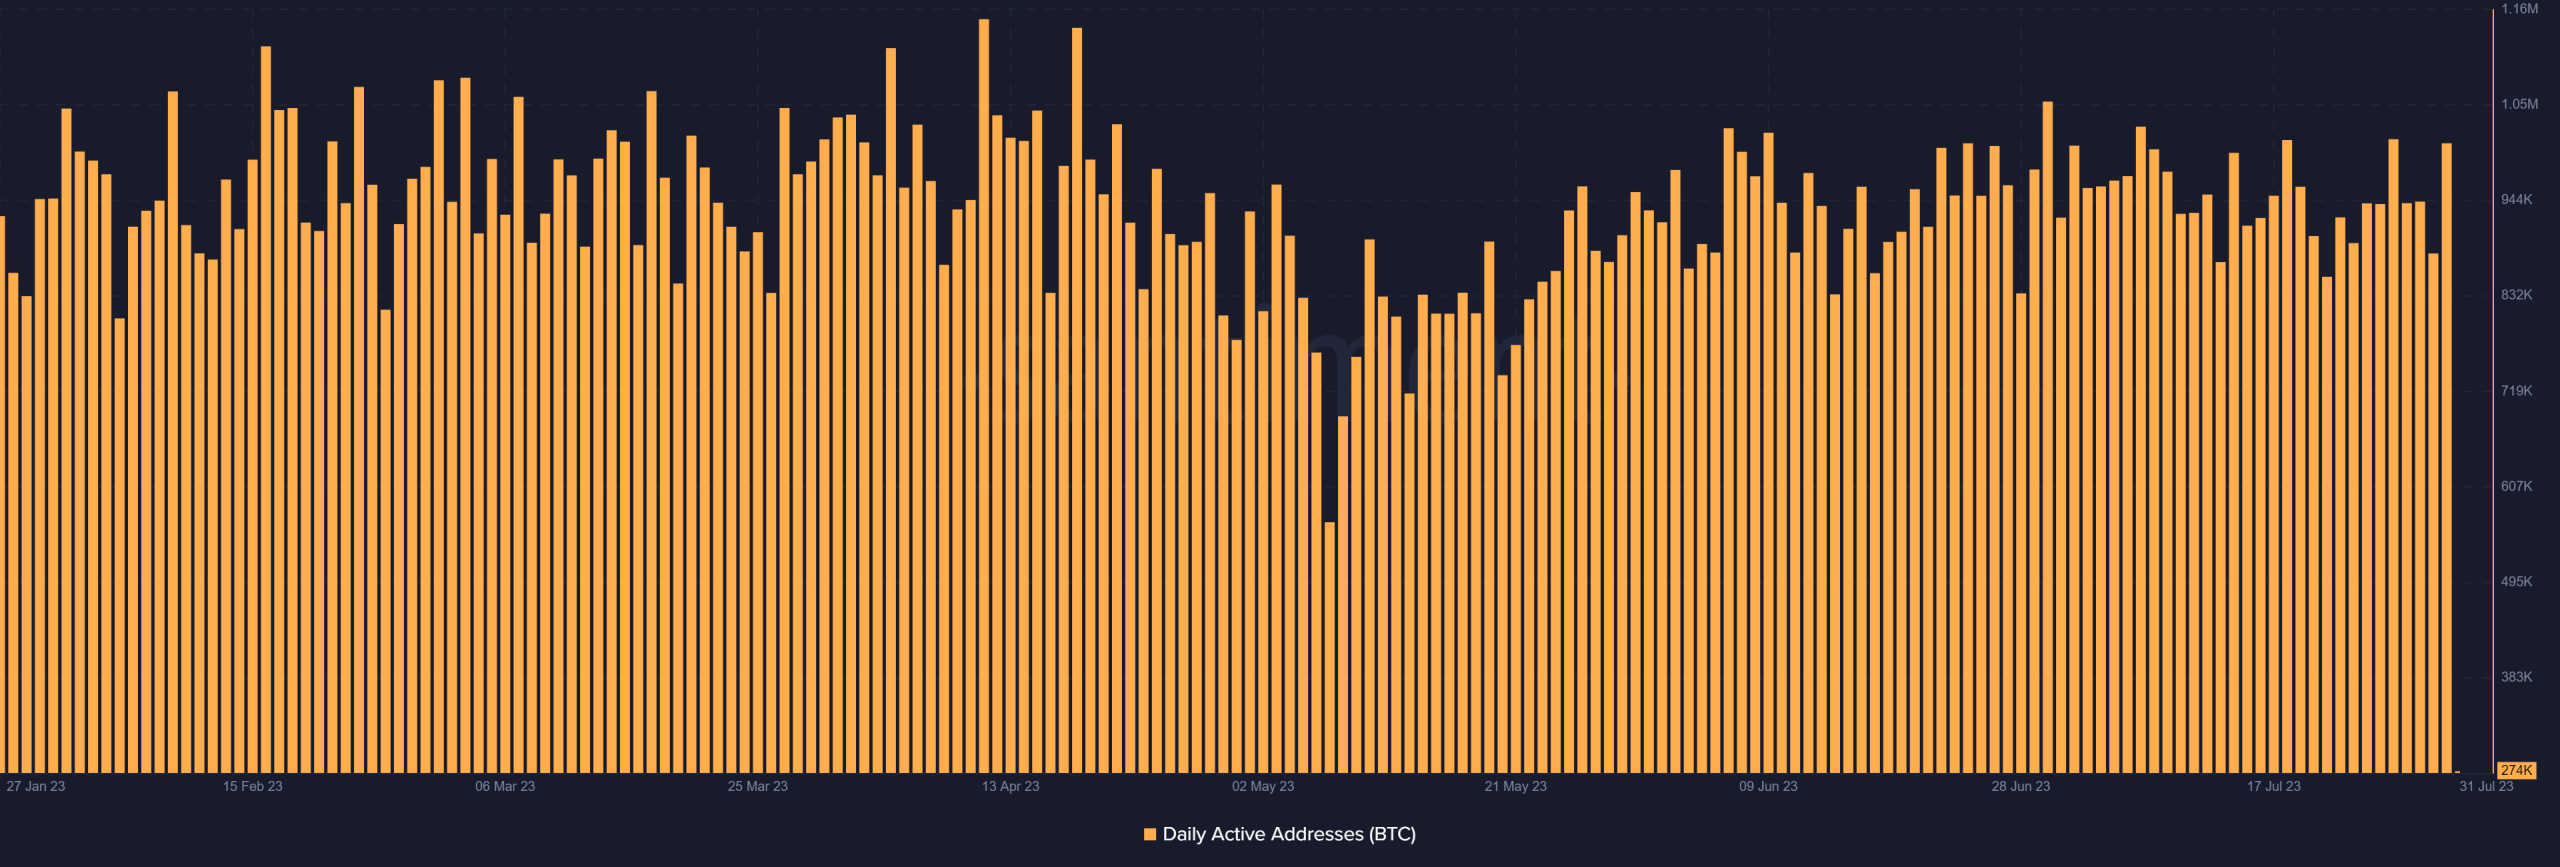
- Bitcoin’s daily active addresses have hit 1 million around 15 times from May to July.
- BTC was trading around $29 500, with less than a 1% increase.
Bitcoin [BTC] has been relentlessly striving to reach and uphold the $30,000 price mark, a goal that has proven elusive over recent weeks. While one might swiftly attribute this to the overwhelming presence of sell pressure, another essential factor could shed light on the sluggish price trajectory.
How much are 1,10,100 XRPs worth today
Bitcoin daily active addresses falter
Beyond the price movements of Bitcoin, which often seize the attention of observers, a crucial metric can significantly impact its value: the number of active addresses. This on-chain activity, as revealed by Santiment’s daily active address metric, holds the key to unraveling the underlying dynamics.
Taking a closer look at this metric, it became evident that there has been a noticeable decline in the number of daily active addresses on the network. While a casual glance may not reveal the full extent of this change, a thorough analysis painted a clearer picture. Throughout May, daily active addresses consistently remained below the 1 million mark.

Source: Santiment
However, there was a positive development in June as the metric managed to surpass 1 million on seven separate occasions. Yet, this upward trend slightly waned as June progressed, with the number crossing the 1 million threshold only six times.
As of this writing, the number of daily active addresses was around 239,000, which indicated a noteworthy decrease. Nevertheless, the 30-day active addresses metric offered a glimmer of hope, showing a slight uptrend with the total number of active addresses exceeding 18 million. This upward movement can be traced back to early June, although the progress has been relatively stagnant in recent times, as indicated by the chart.
How Bitcoin has trended
Upon analyzing the daily timeframe trend of Bitcoin, May was a rather uneventful month for this asset. The chart revealed a period of relative tranquility, when no significant price movements occurred. Also, no trading session ended with a notable 5% increase or decrease.
However, as the calendar flipped to June, the scene changed dramatically. The month saw more excitement, with Bitcoin’s price breaking into the much-anticipated $30,000 price range.
Early July saw the price attempting to extend its reach beyond the $30,000 mark, but unfortunately, it couldn’t sustain this upward momentum. As the last weeks of July unfolded, the price trend displayed a more subdued demeanor, struggling to push further.

Source: TradingView
The $30,000 price range transformed into a psychological resistance level, presenting a formidable barrier to Bitcoin’s ascent. As of this writing, it was trading at around $29,500, showcasing a minimal increase of less than 1%.
Another noteworthy observation was the short Moving Average (yellow line) positioning above the price trend, albeit marginally. This configuration signaled that the prevailing price run could have performed better.
Read Bitcoin (BTC ) Price Prediction 2023-24
BTC flow signals normal flow
Despite the seemingly unimpressive price movement of Bitcoin, there was yet to be a notable surge in its exchange flow.
The netflow metric on CryptoQuant indicated a fluctuation between inflows and outflows in the past few days. Interestingly, the recent trend has seen more inflows, except for 30 July. As of this writing, the inflow hovered around 590, while the outflow was over 200.

Source: CryptoQuant







