
- LINK has seen over 9% increase in the last 24 hours.
- Volume remained below $1 billion despite a price rise.
Over the last 24 hours, Chainlink [LINK] has experienced a more significant price surge than the top 10 cryptocurrencies. Given this notable increase, are other important metrics indicating similar positive trends?
Chainlink takes the lead in the 24-hour price surge
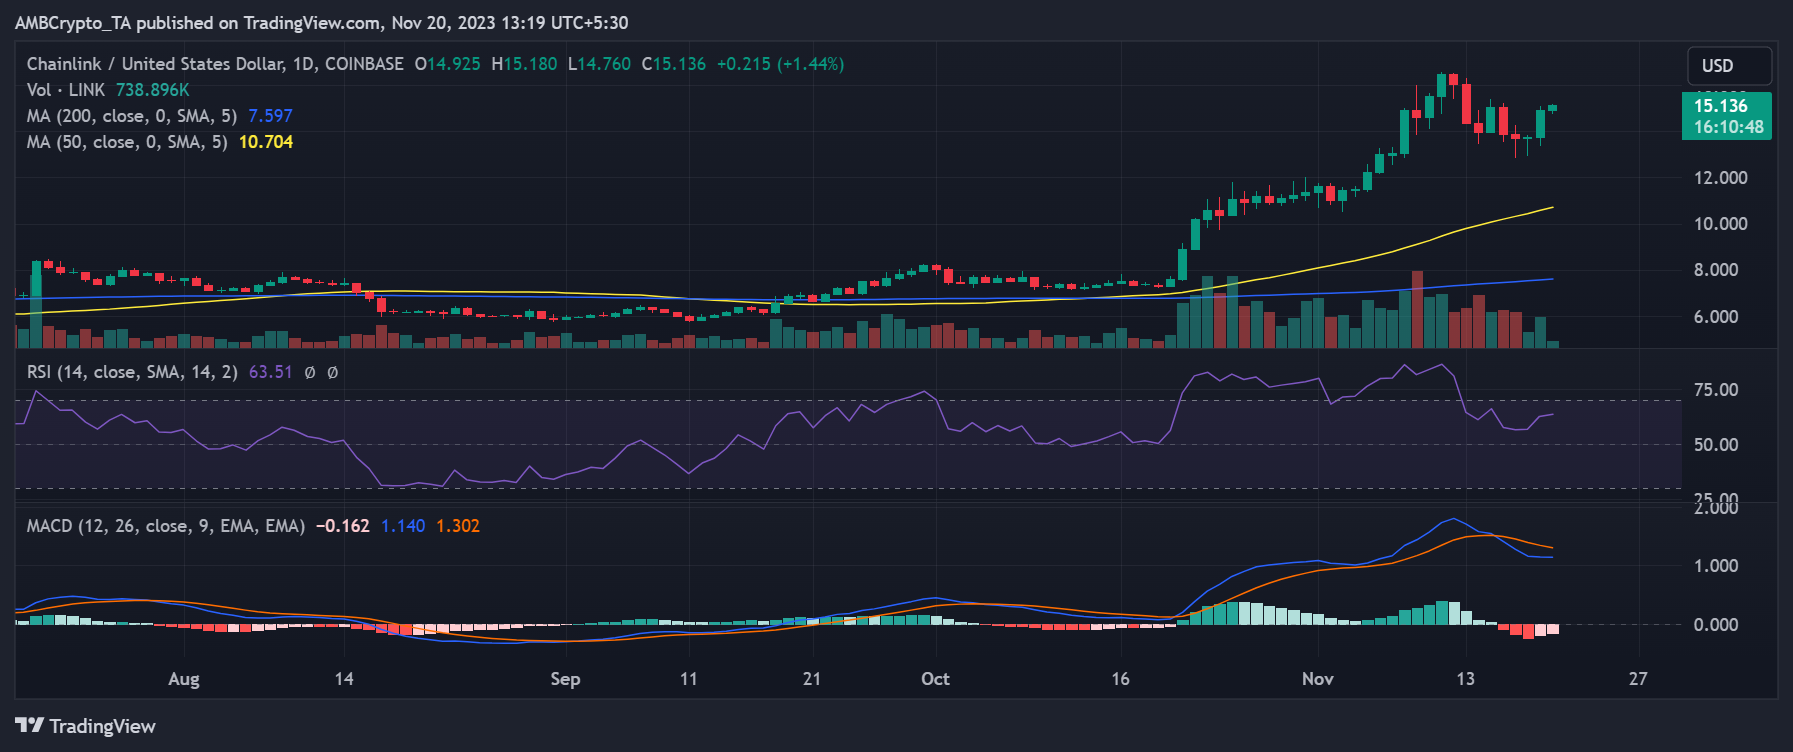
Analyzing Chainlink’s price movements revealed a positive start to the week. On the daily timeframe, it recorded an 8.45% increase in value by the close of trading on the 18th of November. It reached around $14.9 compared to its opening price of around $13.7.
As of this writing, it was trading at about $15, reflecting a further 1% increase.
Also, data from CoinMarketCap indicated that, within the last 24 hours, LINK demonstrated the highest price surge. The data showed it had witnessed almost a 6% increase, with the second-highest at around 3%.
Its press time trend appeared strongly bullish, evident in its Relative Strength Index (RSI) and Moving Average Convergence Divergence (MACD). At the time of writing, the RSI was above 60, and the MACD was above one.

Source: TradingView
Additionally, the $13 and $12 price ranges are identified as support levels based on the current move. The short moving average (yellow line) served as long-term support, particularly around the $10 price range.
Chainlink’s 30-day MVRV shows profitable trend
The ongoing uptrend brought positive news for holders within the 30-day Market Value to Realized Value ratio (MVRV). AMBCrypto’s examination of the Santiment chart revealed that the Chainlink MVRV was positioned above zero, standing at over 14% as of the latest update.
This figure signaled a robust level of profitability for holders.

Source: Santiment
While this surge may be exhilarating for holders, it also served as an initial cautionary signal. The press time MVRV level indicated that holders in this category have experienced a growth of over 14% in their holdings.
However, it also signified a stage where a price reversal could occur soon.
LINK’s volume and address signals caution
AMBCrypto’s review of the volume metric on Santiment indicated that Chainlink has witnessed increased daily volumes since the commencement of its uptrend. The chart illustrated instances where it surpassed $1 billion more than once, signifying a notable uptick in trading activities.
As of this writing, the volume was around $640 million. While this may be considered high, concerns arise when comparing it to the recent price surge.

Source: Santiment
To provide context, on both the 10th and the 11th of November, the volume exceeded $1 billion. On these days, LINK experienced a price increase of over 6%, albeit less than the recent surge of over 8%.
This discrepancy suggested a need for more alignment between the recent price movement and the volume.
An analysis of the 24-hour active addresses chart also revealed a decline. As of this writing, the number of 24-hour active addresses was around 3,900. Decreased volume and active addresses indicate insufficient activity to sustain the upward price trend.
Consequently, this suggested a decline in Chainlink’s price shortly.
LINK to continue rising?
Despite the cautionary signals from volume and active address metrics, Chainlink traders maintained optimism for a continued upswing. AMBCrypto’s review of the Weighted Funding rate chart on Coinglass revealed that LINK’s Funding Rate remained positive.
However, the chart displayed a recent decline, at 0.01% as of press time. This decline signified that traders have moderated their bets on an imminent price rise.
Read Chainlink’s [LINK] Price Prediction 2023-24
Even though several metrics suggested the potential for a downtrend, it’s important to acknowledge that the price of Chainlink may continue to rise. The uptrend can impact these key metrics, potentially leading to a convergence.
The direction in which the unfolding market activities trends will determine LINK trends in the coming days.







