• Crypto
    • Bitcoin
    • Ethereum
    • Altcoins
    • Cardano
    • Solana
  • Web 3
    • Metaverse
    • NFT
  • Blockchain
  • Analysis
  • Learn
  • AI & VR
  • Gaming
  • Marketcap
  • Shop
What's Hot

Is Staking Crypto Safe? What You Should Know Before Staking

September 15, 2026

What Is the CLARITY Act and What Does It Mean for Crypto?

September 14, 2026

What Is Cross Margin in Crypto? How It Works, Risks, and Examples

September 14, 2026
Facebook Twitter Instagram
  • Contact
  • Disclosure
  • Privacy Policy
  • Terms & conditions
Facebook Twitter Instagram
VIP Crypto Signals
  • Crypto
    • Bitcoin
    • Ethereum
    • Altcoins
    • Cardano
    • Solana
  • Web 3
    • Metaverse
    • NFT
  • Blockchain
  • Analysis
  • Learn
  • AI & VR
  • Gaming
  • Marketcap
  • Shop
VIP Crypto Signals
Home » Blog » What’s going on with Ethereum’s addresses? Taking a closer look
Ethereum

What’s going on with Ethereum’s addresses? Taking a closer look

August 2, 2024No Comments3 Mins Read
Share
Facebook Twitter LinkedIn Pinterest Email
  • Ethereum’s daily active addresses have decreased to around 395,000.
  • An address moved over 19,500 ETH to Binance in the last 48 hours.

Ethereum [ETH] has experienced significant growth in its daily active addresses over the year, indicating increased use and engagement within its network.

However, recent trends have showed a decline in these active addresses, suggesting a possible slowdown in activity.

Alongside this decrease, there has been a noticeable shift in market dynamics, with sellers beginning to dominate trading activities. 

Ethereum’s volatile active addresses

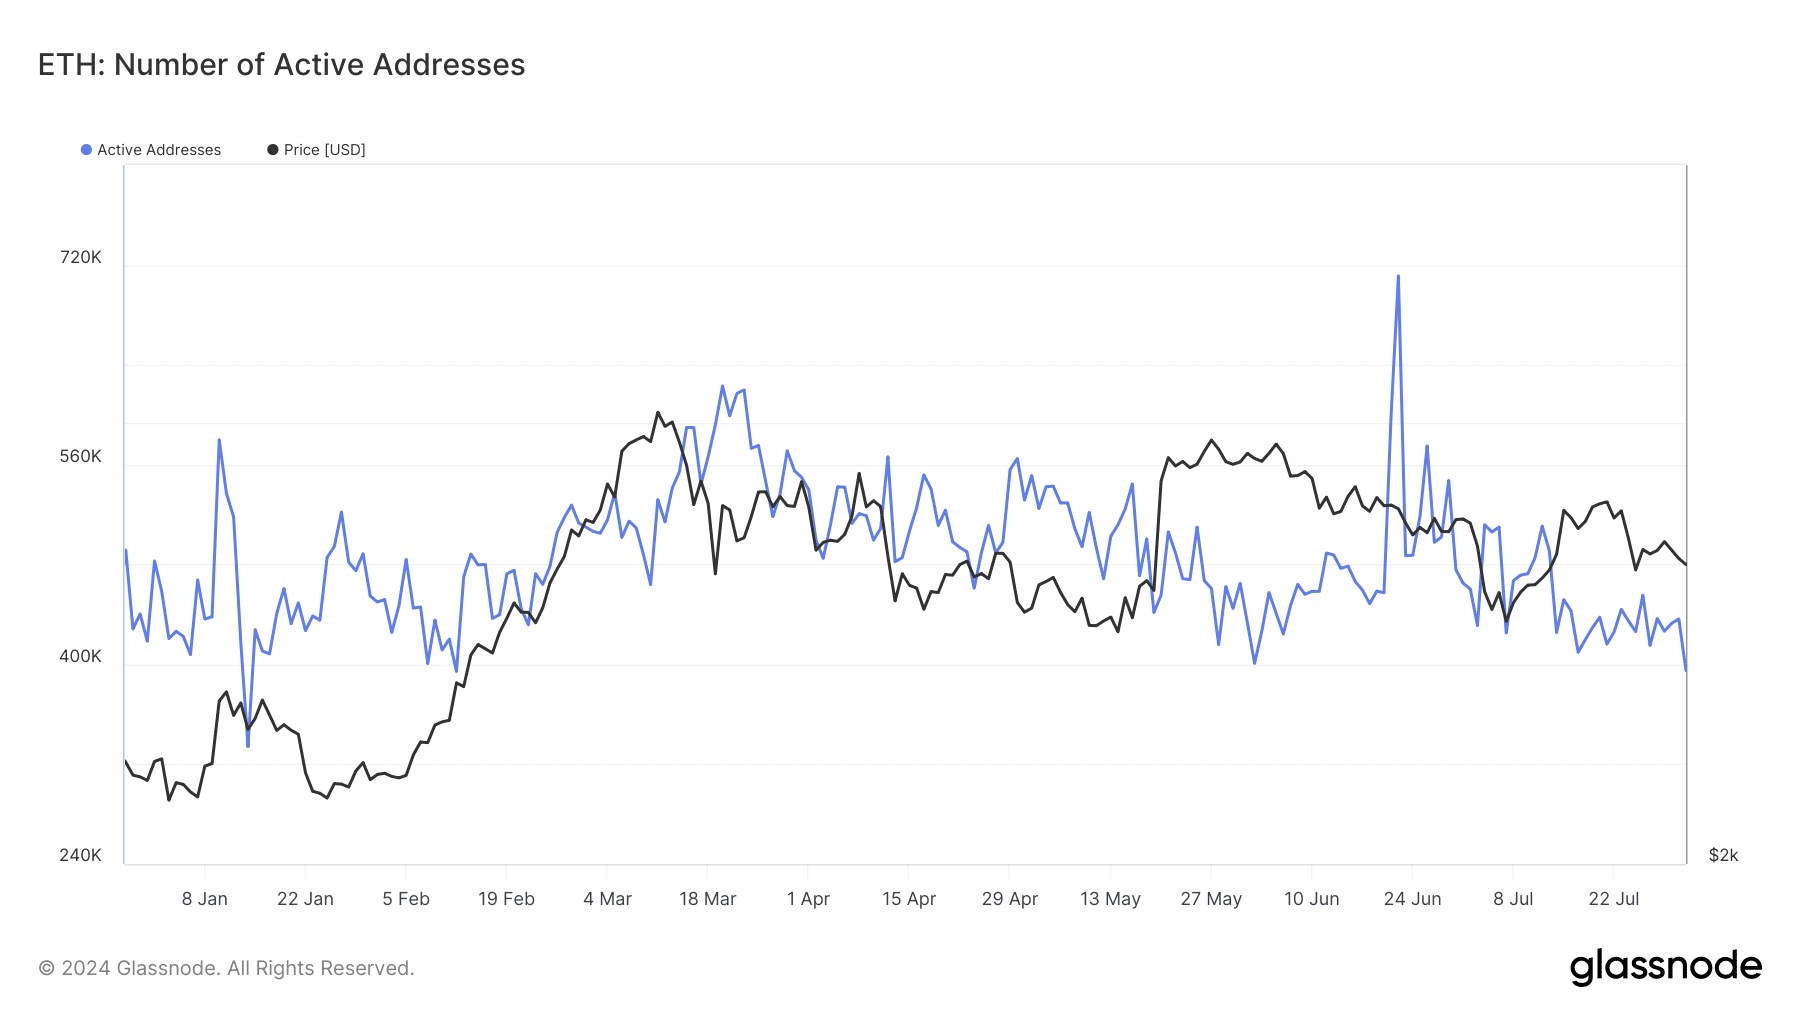
According to data from Glassnode, Ethereum’s daily active address metric has experienced a remarkable increase throughout the year, surging by 127%.

This substantial growth has primarily been driven by heightened activity on Layer 2 (L2) platforms, per the report.

An in-depth analysis of the active addresses metric on Glassnode highlighted a peak in daily active addresses, reaching over 700,000 in June.

However, recent weeks have witnessed a downward trend in this metric. After a significant rise to over 510,000 in July, the number of active addresses began to taper off.
Ethereum active adresses

Source: Glassnode

By the end of July, this figure had reduced to approximately 436,000. As of the latest data, it has further decreased to around 395,000.

Ethereum sellers appear more active

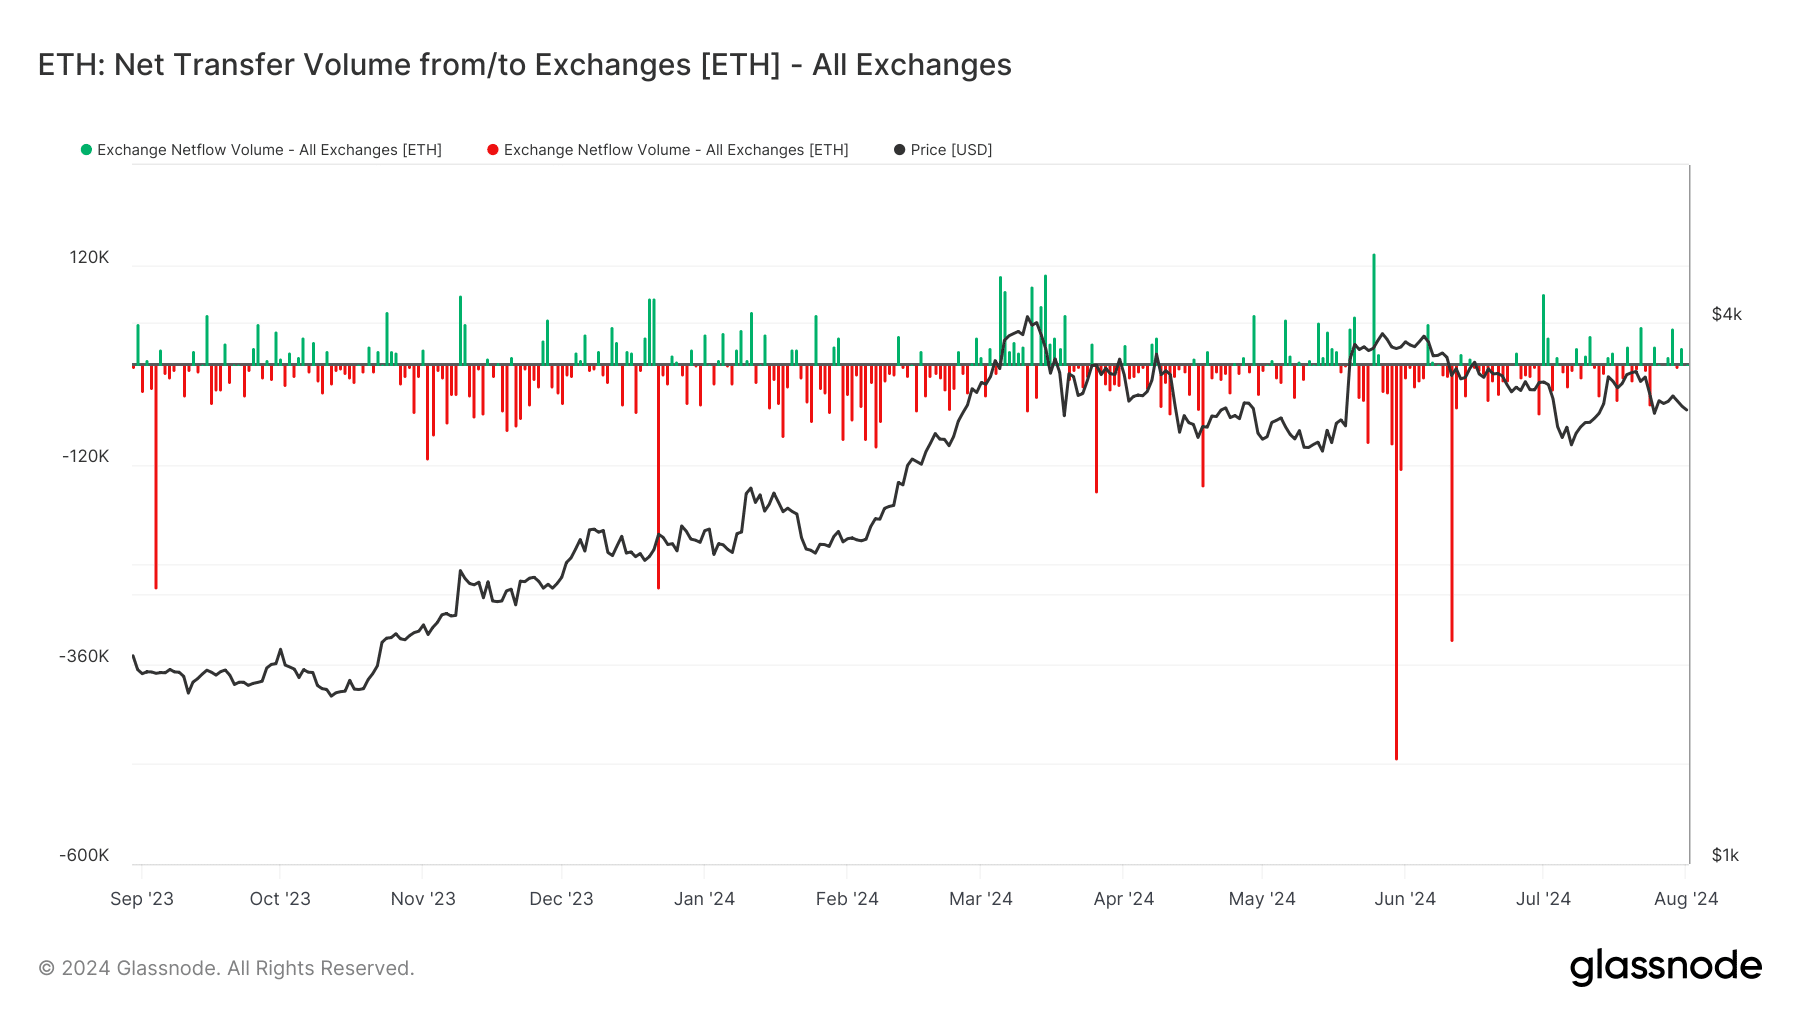
The recent analysis of Ethereum’s netflow on Glassnode has highlighted a notable trend. It showed more ETH was being moved into exchanges than was being withdrawn.

The move suggested a predominance of selling activity among holders. Over the past month, this trend culminated with a significant influx of over 22,000 ETH into exchanges.

Further intensifying this trend, data from Lookonchain revealed that specific accounts have been particularly active in transferring ETH to exchanges.

See also  Ethereum turns deflationary: What it means for ETH prices in 2025

In the last 48 hours alone, these accounts sent a total of 19,500 ETH, valued at nearly $64 million, to the Binance exchange.

Such large-scale movements to exchanges generally indicate a readiness to sell, contributing to increased supply on the market.
Ethereum Netflow

Source: Galssnode

This influx of ETH to exchanges has coincided with and likely contributed to the recent decline in Ethereum’s price.

As more ETH becomes available on the market through these exchanges, the increased selling pressure can lead to a downward trend in price, especially if demand does not keep pace with the new supply.


Is your portfolio green? Check out the ETH Profit Calculator


RSI shows increasing bear trend

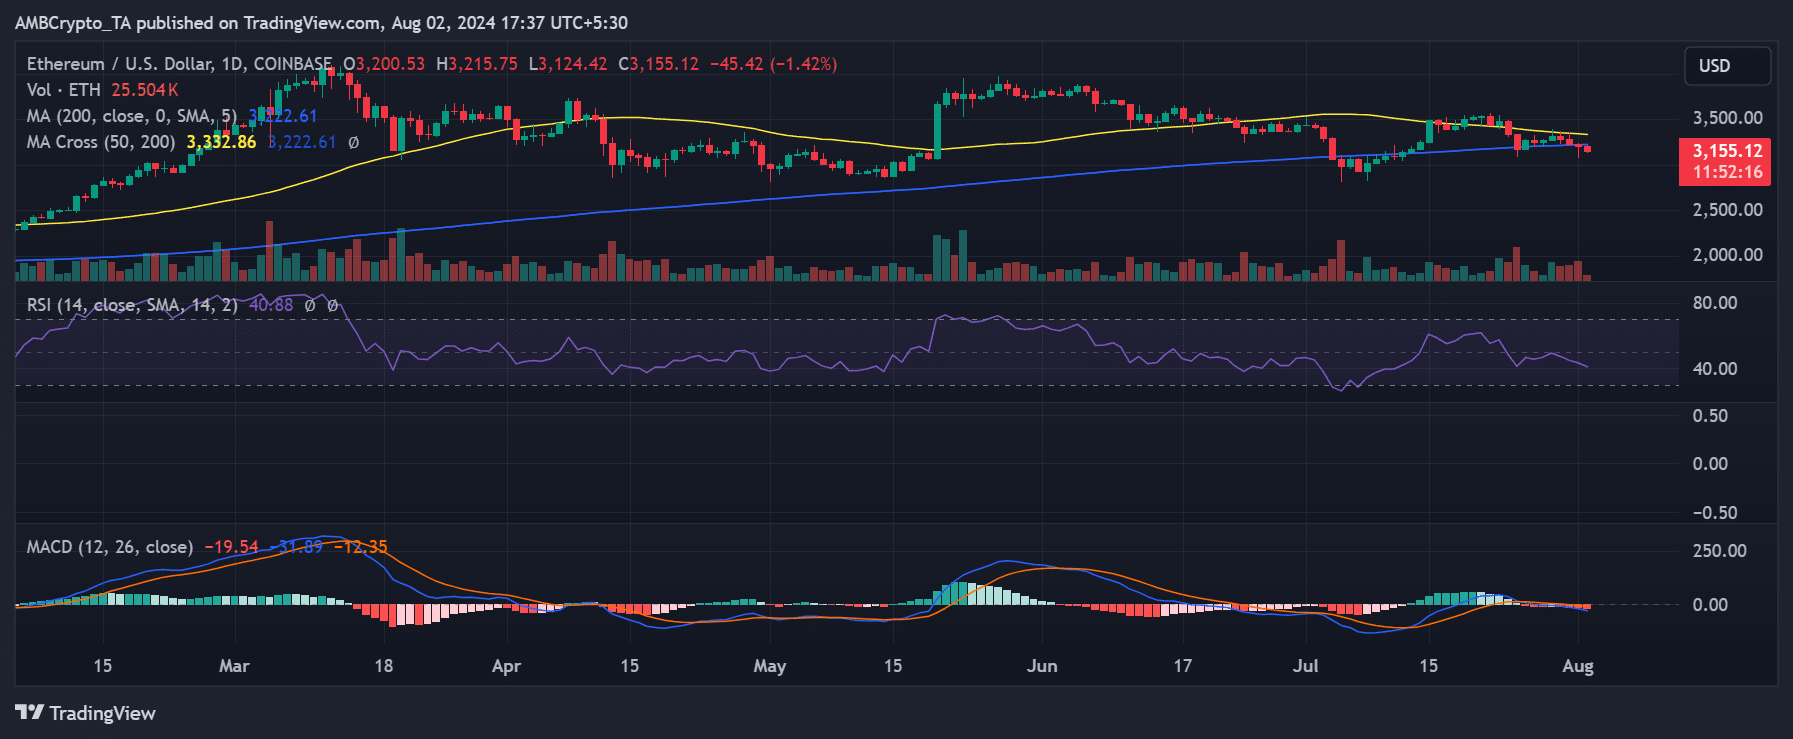
An analysis of Ethereum’s daily price trend revealed a decline of over 1.4% at the time of writing. The price was approximately $3,154, marking the fourth consecutive day of decreases.

According to AMBCrypto, the decline began around the 30th of July, and Ethereum has been on a downward trend ever since. The Relative Strength Index (RSI) is about 41, indicating a strengthening bearish trend.
ETH price trend

Source: TradingView

Next: Polymarket’s $1 billion win – Is ‘Trump vs Harris’ solely responsible?

Source link

addresses Closer Ethereums Whats
Share. Facebook Twitter Pinterest LinkedIn Tumblr Email

Related Posts

Blockspace Futures: How Ethereum’s Most Valuable Commodity is Being Financialized in 2026

May 25, 2026

The Human Patch: How Ethereum’s Clear Signing Standard Is Tackling Crypto’s Most Exploited Vulnerability

May 14, 2026

The Glamsterdam Ethereum Upgrade: Ethereum’s Most Ambitious Redesign Since the Merge

April 20, 2026

How Ethereum’s New Strawmap Could Change Blockchain Gaming Forever

February 27, 2026
Add A Comment

Leave A Reply Cancel Reply

Top Posts

Is Staking Crypto Safe? What You Should Know Before Staking

September 15, 2026

What Is the CLARITY Act and What Does It Mean for Crypto?

September 14, 2026

What Is Cross Margin in Crypto? How It Works, Risks, and Examples

September 14, 2026

Subscribe to Updates

Get the latest news and Update from VIP Crypto Signals about Crypto, Web3, Metaverse, NFT and more.

Our mission is to develop a community of people who try to make financially sound decisions. The website strives to educate individuals in making wise choices about Cryptocurrencies, NFT, Metaverse and more.

We're social. Connect with us:

Facebook Twitter Instagram Pinterest YouTube
Top Insights

Is Staking Crypto Safe? What You Should Know Before Staking

September 15, 2026

What Is the CLARITY Act and What Does It Mean for Crypto?

September 14, 2026

What Is Cross Margin in Crypto? How It Works, Risks, and Examples

September 14, 2026
Get Informed

Subscribe to Updates

Get the latest news and Update from VIP Crypto Signals about Crypto, Web3, Metaverse, NFT and more.

Facebook Twitter Instagram Pinterest
  • Contact
  • Disclosure
  • Privacy Policy
  • Terms & conditions
© 2026 Vip Crypto Signals - All rights reserved.

Type above and press Enter to search. Press Esc to cancel.

  • FibSwap DEXFibSwap DEX(FIBO)$0.0084659.90%
  • bitcoinBitcoin(BTC)$70,953.006.13%
  • ethereumEthereum(ETH)$3,664.5818.50%
  • tetherTether(USDT)$1.00-0.01%
  • binancecoinBNB(BNB)$627.698.99%
  • solanaSolana(SOL)$181.131.69%
  • staked-etherLido Staked Ether(STETH)$3,662.5418.48%
  • usd-coinUSDC(USDC)$1.00-0.02%
  • rippleXRP(XRP)$0.545.05%
  • dogecoinDogecoin(DOGE)$0.1634778.14%


