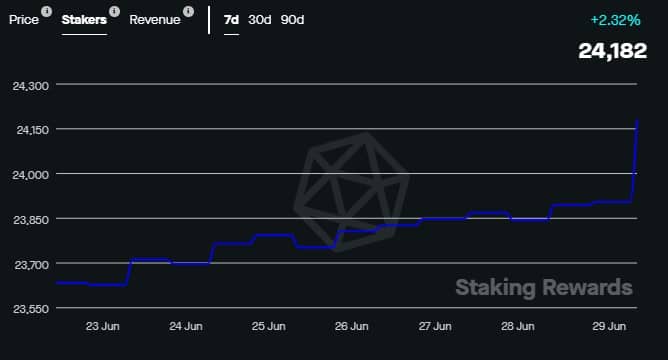
- The number of MATIC stakers increased considerably over the last week
- A few of the market indicators and metrics also looked bullish on MATIC
Polygon [MATIC] has once again turned its chat red as it registered a decline in its prices over the 24 hours. Though the price declined, Polygon enthusiasts had great news as the latest announcement made by the blockchain added much value and capabilities to the network.
Interestingly, a few of the metrics suggested that MATIC investors might have more reason to celebrate as they suggested a further uptrend.
Read Polygon’s [MATIC] Price Prediction 2023-=24
Polygon 2.0 and this new update!
Polygon, in a recent tweet, revealed information about its new Polygon 2.0. As per the tweet, the new update is designed to provide unlimited scalability and unified liquidity, thus transforming Polygon into the value layer of the Internet.
For starters, the Polygon 2.0 architecture consists of four protocol layers, each enabling an important process within the network: staking, interop, execution, and proving. It was interesting to note that in the seven days itself, Polygon’s staking space witnessed growth.
As per Staking Rewards, the number of MATIC stakers have increased over the last seven days.

Source: Staking Rewards
Change on the cards for MATIC
Unlike the blockchain’s staking space, MATIC’s price registered a decline over the last few days. As per CoinMarketCap, MATIC was down by more than 4% in the last seven days. Moreover, its daily chart was also painted red. At press time, it was trading at $0.632 with a market capitalization of over $5.8 billion, making it the 13th largest crypto.
A look at Coinglass’ data revealed that MATIC’s open interest was declining. A drop in the metric means that the on-going price trend might soon come to an end. This suggested that MATIC’s bearish price trend could change soon. The token’s Market Value to Realized Value (MVRV) also improved substantially, which was a bullish signal.

Source: Santiment
Is your portfolio green? Check the Polygon Profit Calculator
It’s the bulls vs bears now…
A look at Polygon’s daily chart portrayed an ambiguous picture, as a number of metrics were bullish. However, the rest portrayed a different picture altogether. For instance, the Relative Strength Index (RSI) registered an uptick.
MATIC’s Moving Average Convergence Divergence (MACD) also displayed a bullish advantage in the market. Nonetheless, the gap between the 20-day Exponential Moving Average (EMA) and the 55-day EMA was increasing. This did paint a concerning picture for the token’s price.

Source: TradingView


