
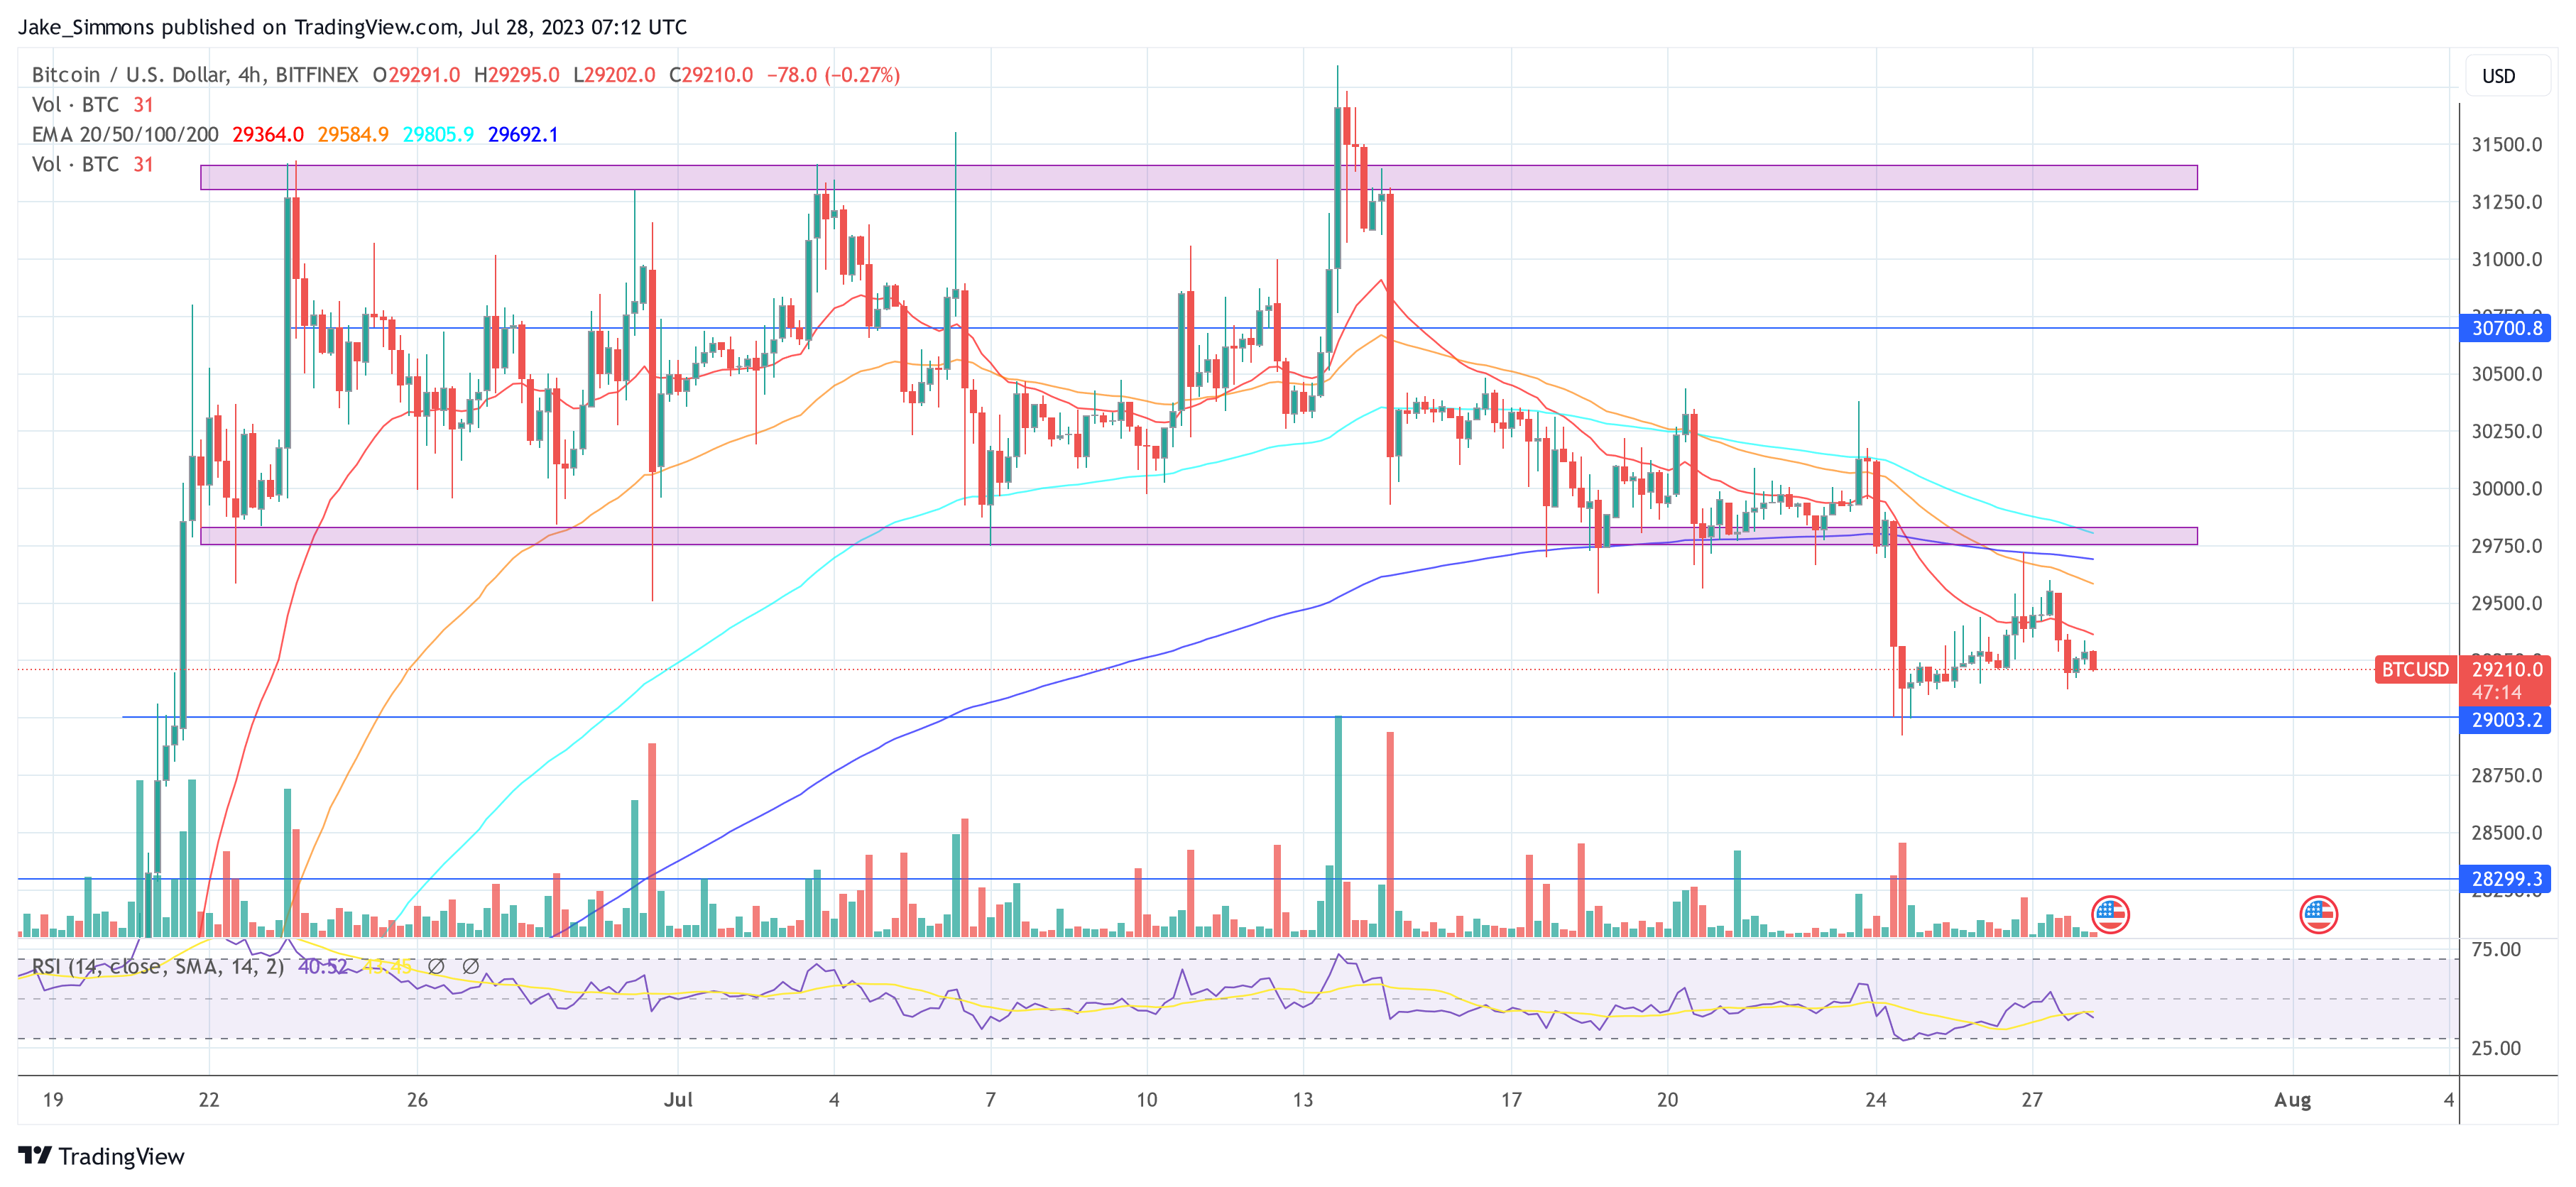
The Bitcoin price is currently in an uncertain situation. After BTC broke below the one-month trading range between $29.800 and $31.500, the bulls have so far failed to recapture this area. A first attempt failed on Wednesday at $29.725, a second effort on Thursday at $29.600.
On the other hand, the bears currently also fail to push the price below the critical support at $29.000. In which direction the next movement will go is, as always, pure speculation, but data can give indications.
Bullish Signal 1: Decreasing BTC Supply On Exchanges
Renowned crypto analyst Ali Martinez shared an intriguing bullish chart, revealing that only 2.25 million BTC are currently held in known crypto exchange wallets. This is the lowest Bitcoin supply on trading platforms since January 2018.
The data suggests that investors and long-term holders are refraining from selling and are instead choosing to keep their BTC off exchanges. This “hodling” behavior indicates a positive sentiment BTC holders.
Bullish Signal 2: Lack Of Inflows From Bitcoin Whales
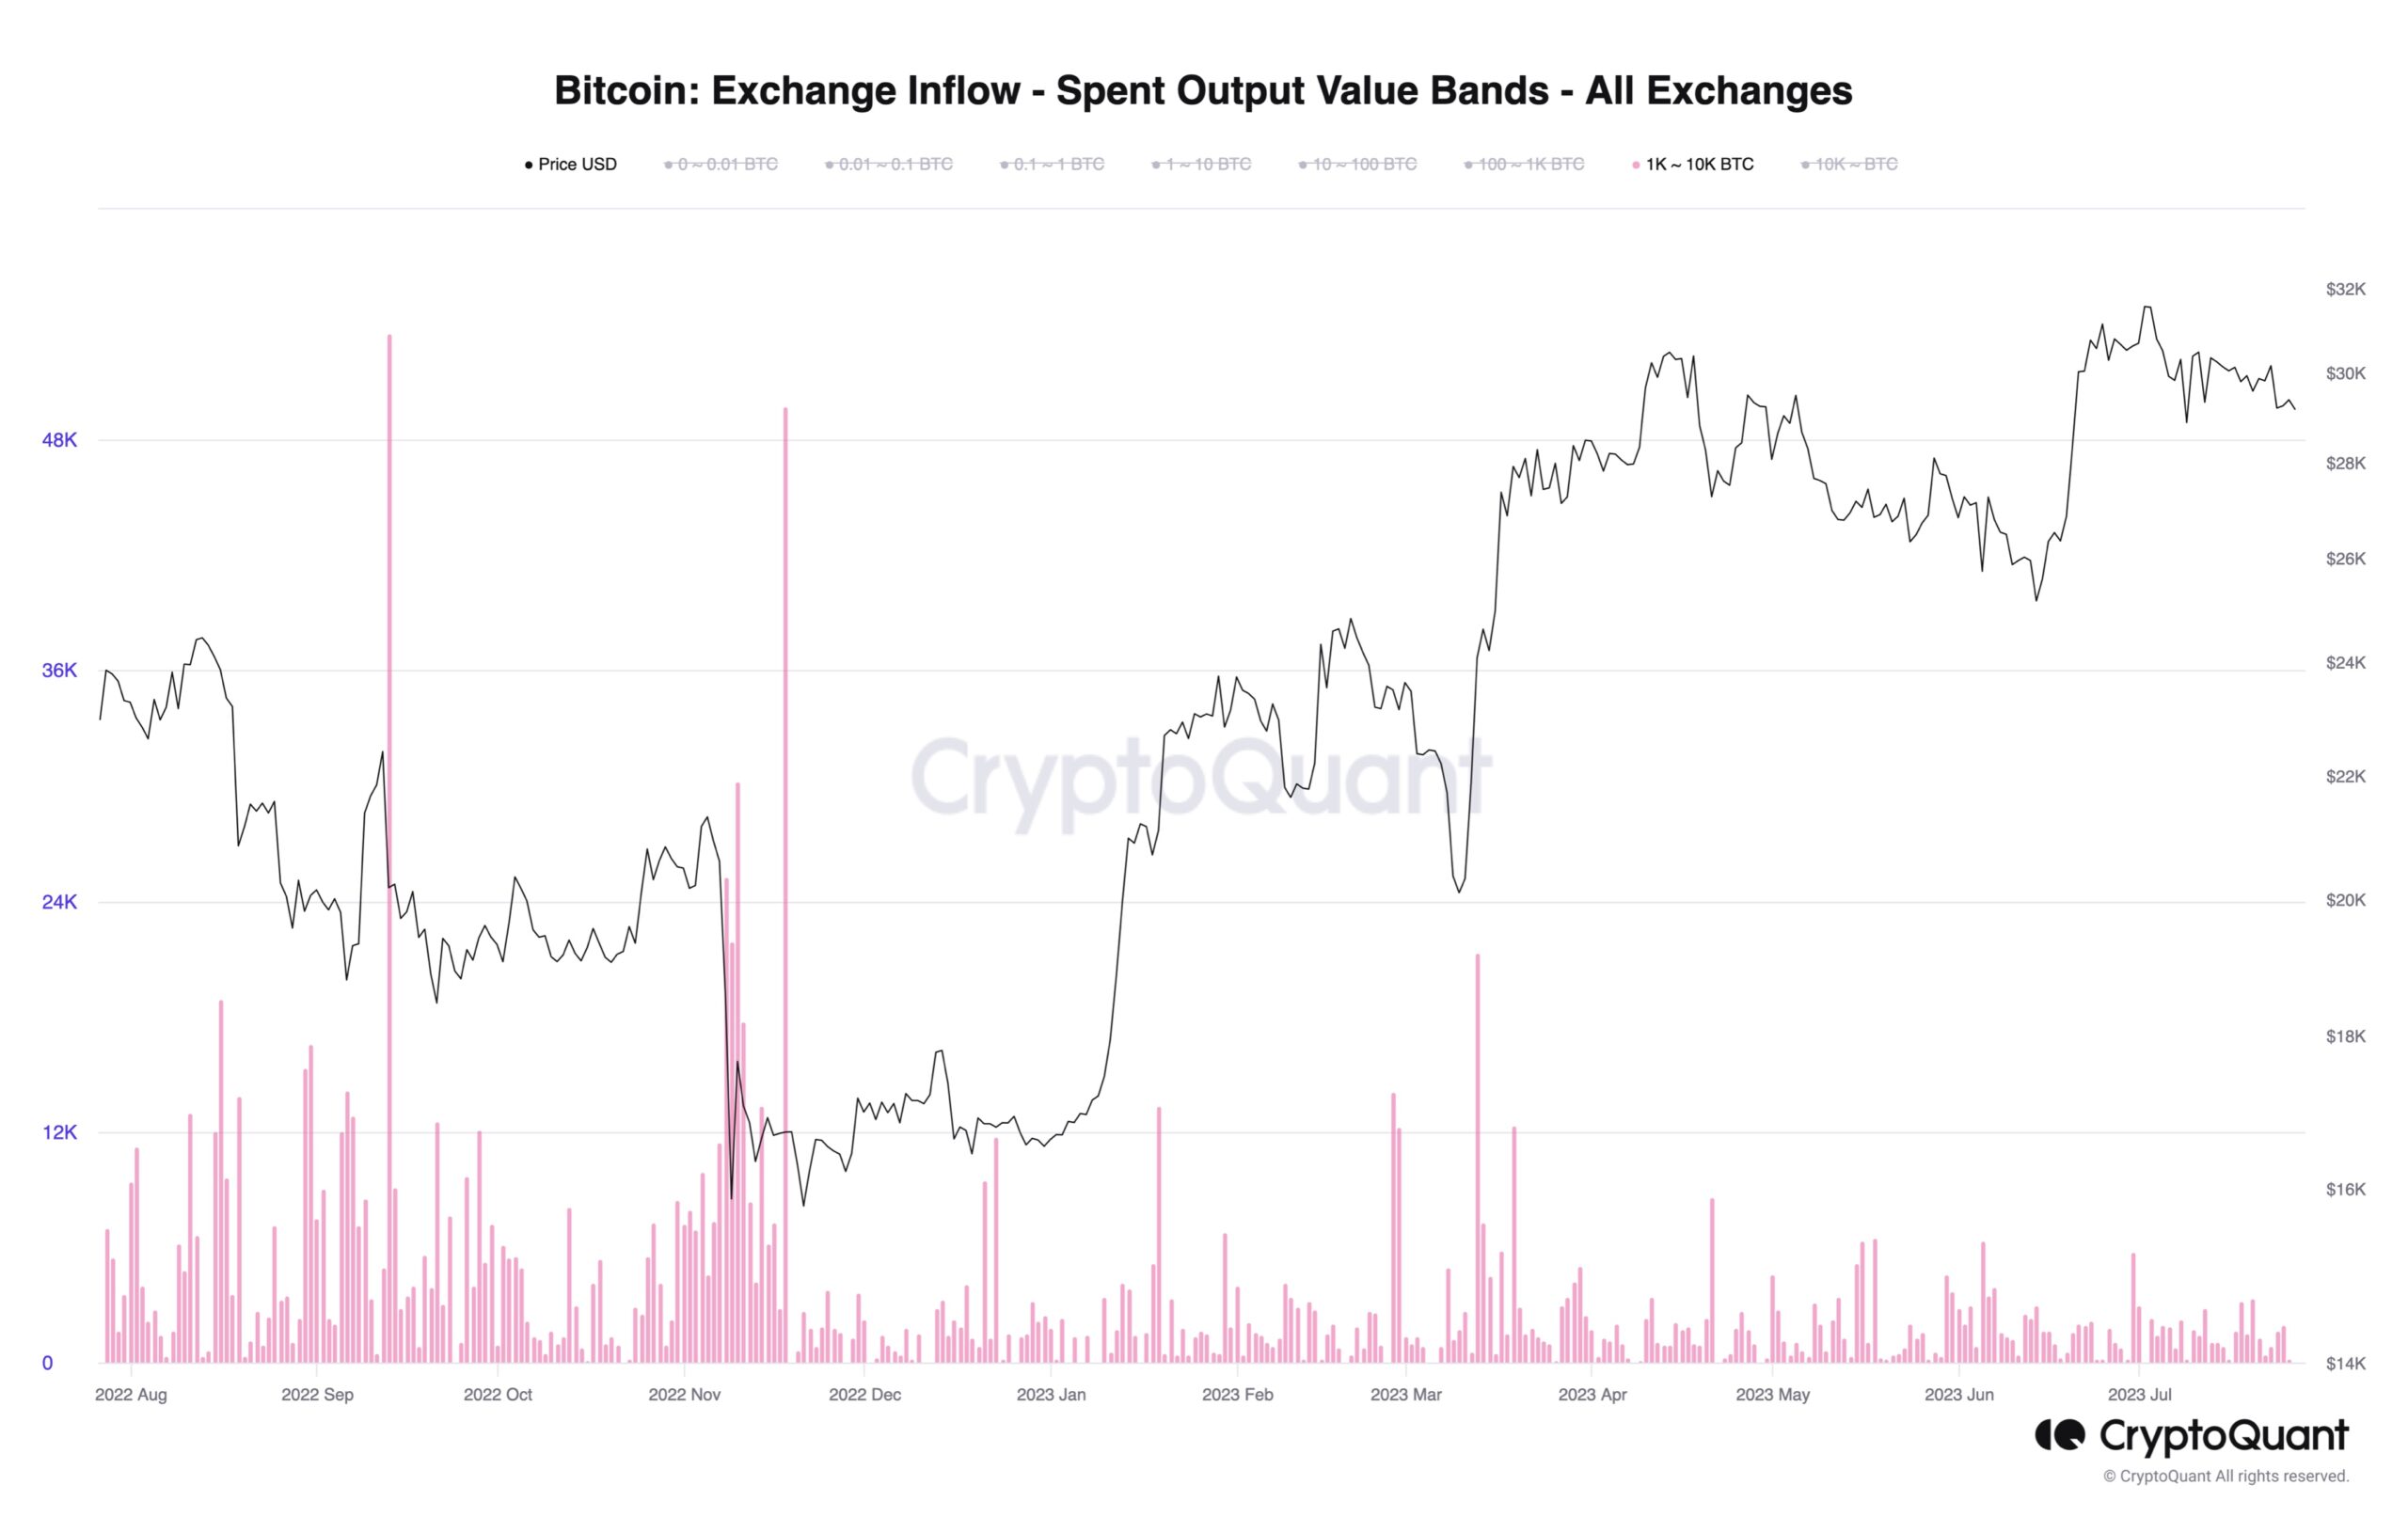
Head of Research at CryptoQuant, Julio Moreno, pointed out another bullish sign when he shared a chart showing a lack of inflows from large investors with 1,000 to 10,000 BTC (aka Bitcoin whales) into exchanges. Moreno stated, “”Not really seeing Bitcoin whale inflows into exchanges.”
Additionally, the same trend is observed among smaller investors, indicating a reluctance to deposit BTC into centralized exchanges. Commenting on the exchange deposit transactions (7-day SMA) chart, Moreno added, “indeed, seems nobody wants to deposit into centralized exchanges.”
Such behavior suggests that significant holders and institutions are holding onto their BTC assets, potentially anticipating future price increases.
Bearish Signal: Short-Term Holder (STH) MVRV Metric
On-chain analyst Axel Adler Jr. addressed the short-term holder (STH) MVRV metric, saying: “STH MVRV is actively falling and we may see something similar to what happened in the two previous corrections.” The chart shown by Adler reveals that the STH MVRV fell either close to 0 or even below during the lows of the sharp Bitcoin price corrections in mid-March and mid-June.
Currently, the STH MVRV is still somewhat elevated, so a last pullback in the Bitcoin price triggered by short term holder selling may be necessary for the MVRV to reset to 0.
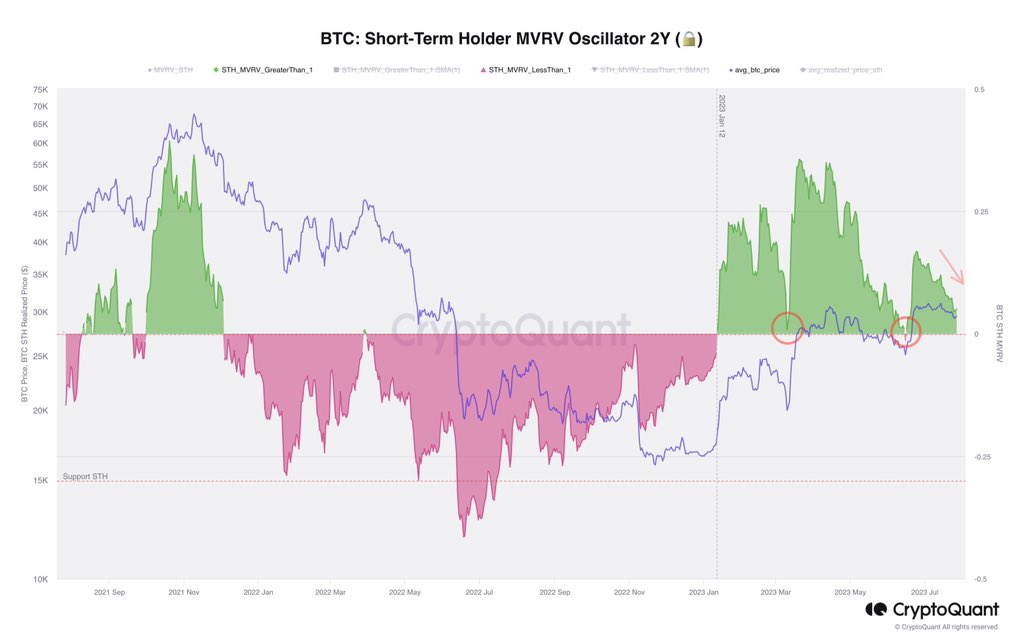
Adler also remarked that there isn’t a substantial Inflow to futures exchanges at the moment like there was in March and June. “Don’t expect a sharp breakthrough upwards or downwards,” added Adler.
BTC Binance Spot Liquidity Analysis
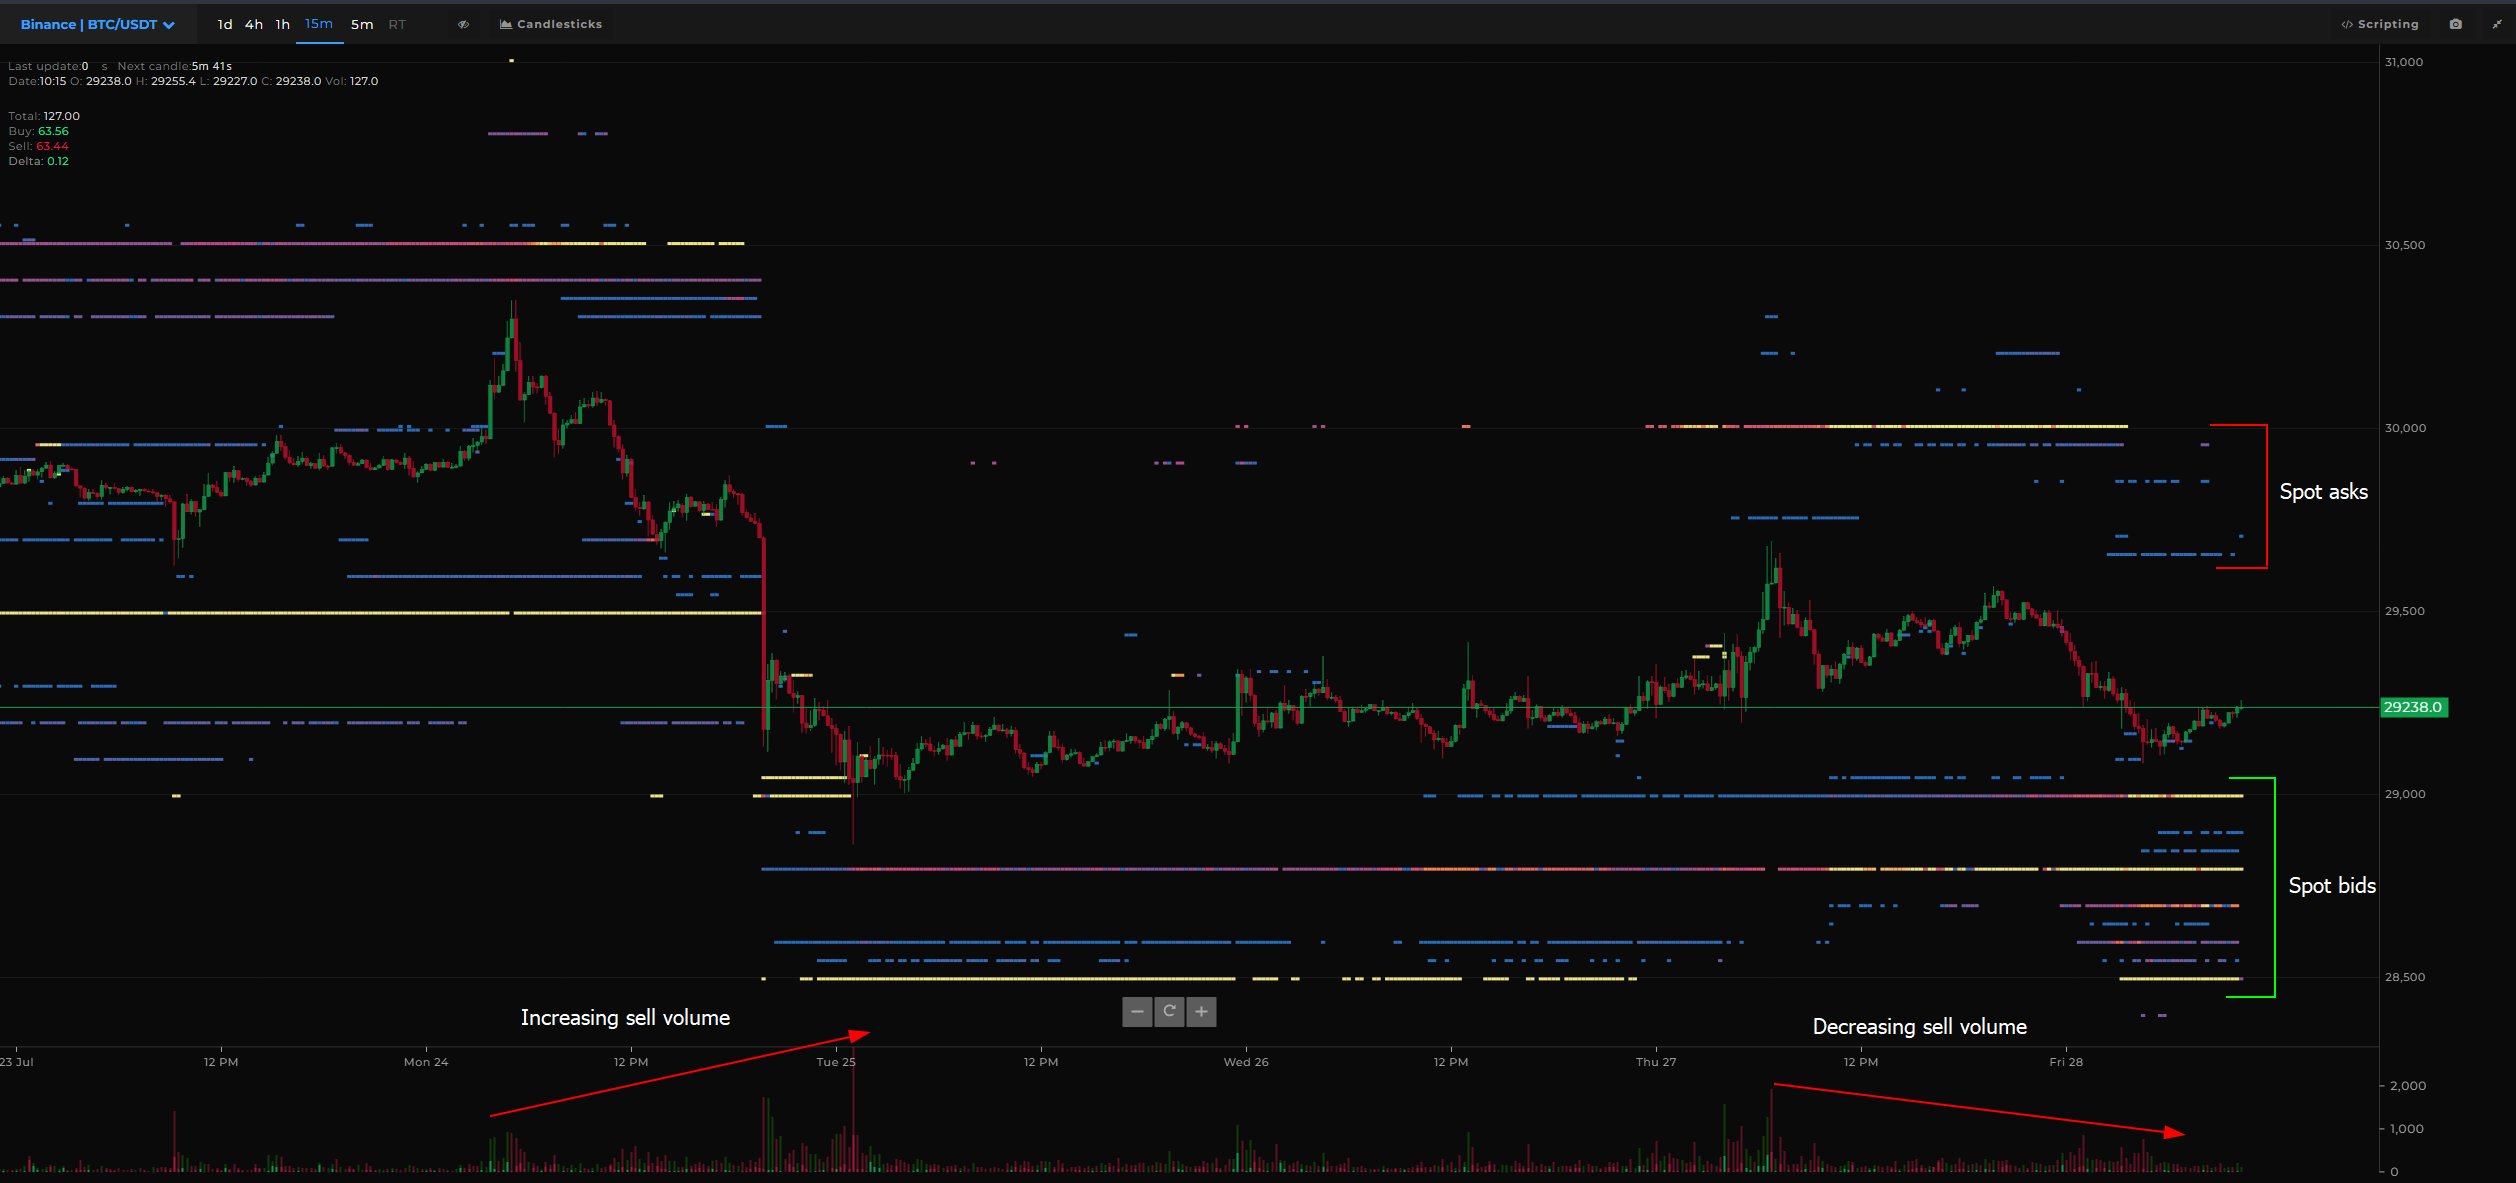
Analyst @52kskew shared a comprehensive analysis of BTC Binance spot liquidity, highlighting an interesting observation. The bid liquidity (bids > asks) and spot asks moved lower towards price due to low volatility. He added, “note the difference in volume leading to previous selloff & current falling volume & minimal decline.”
Given the bid liquidity between $29,000 and $28,500, this area could be the point for buyers to step in if BTC experiences a pullback. In a bullish scenario, spot buying would occur in this area, followed by a rotation out of shorts. New longs get opened and price migrates towards spot supply near $30,000. In a sell off scenario, price grinds through spot bid liquidity and forced selling occurs, says Skew.
Potential Impact of Economic Data On Bitcoin
In addition, it is crucial to keep an eye on macroeconomic factors that could influence Bitcoin’s price. The release of the Personal Consumption Expenditures Price Index (PCE) at 8:30 am EST today is of particular importance.
During Wednesday’s FOMC press conference, Fed Chairman Jerome Powell stressed the importance of core inflation, which is proving sticky. Therefore, the Core PCE in particular, needs to continue falling to alleviate the Fed’s inflation concerns. If the 4.2% expectation for core PCE is exceeded, a bullish reaction from Bitcoin can be expected.
At press time, the Bitcoin price stood at $29,210.
Featured image from iStock, chart from TradingView.com







