• Crypto
    • Bitcoin
    • Ethereum
    • Altcoins
    • Cardano
    • Solana
  • Web 3
    • Metaverse
    • NFT
  • Blockchain
  • Analysis
  • Learn
  • AI & VR
  • Gaming
  • Marketcap
  • Shop
What's Hot

Is Staking Crypto Safe? What You Should Know Before Staking

September 15, 2026

What Is the CLARITY Act and What Does It Mean for Crypto?

September 14, 2026

What Is Cross Margin in Crypto? How It Works, Risks, and Examples

September 14, 2026
Facebook Twitter Instagram
  • Contact
  • Disclosure
  • Privacy Policy
  • Terms & conditions
Facebook Twitter Instagram
VIP Crypto Signals
  • Crypto
    • Bitcoin
    • Ethereum
    • Altcoins
    • Cardano
    • Solana
  • Web 3
    • Metaverse
    • NFT
  • Blockchain
  • Analysis
  • Learn
  • AI & VR
  • Gaming
  • Marketcap
  • Shop
VIP Crypto Signals
Home » Blog » XRP Dominance Reveals Start Of Next Parabolic Price Move
Altcoins

XRP Dominance Reveals Start Of Next Parabolic Price Move

October 20, 2023No Comments3 Mins Read
Share
Facebook Twitter LinkedIn Pinterest Email

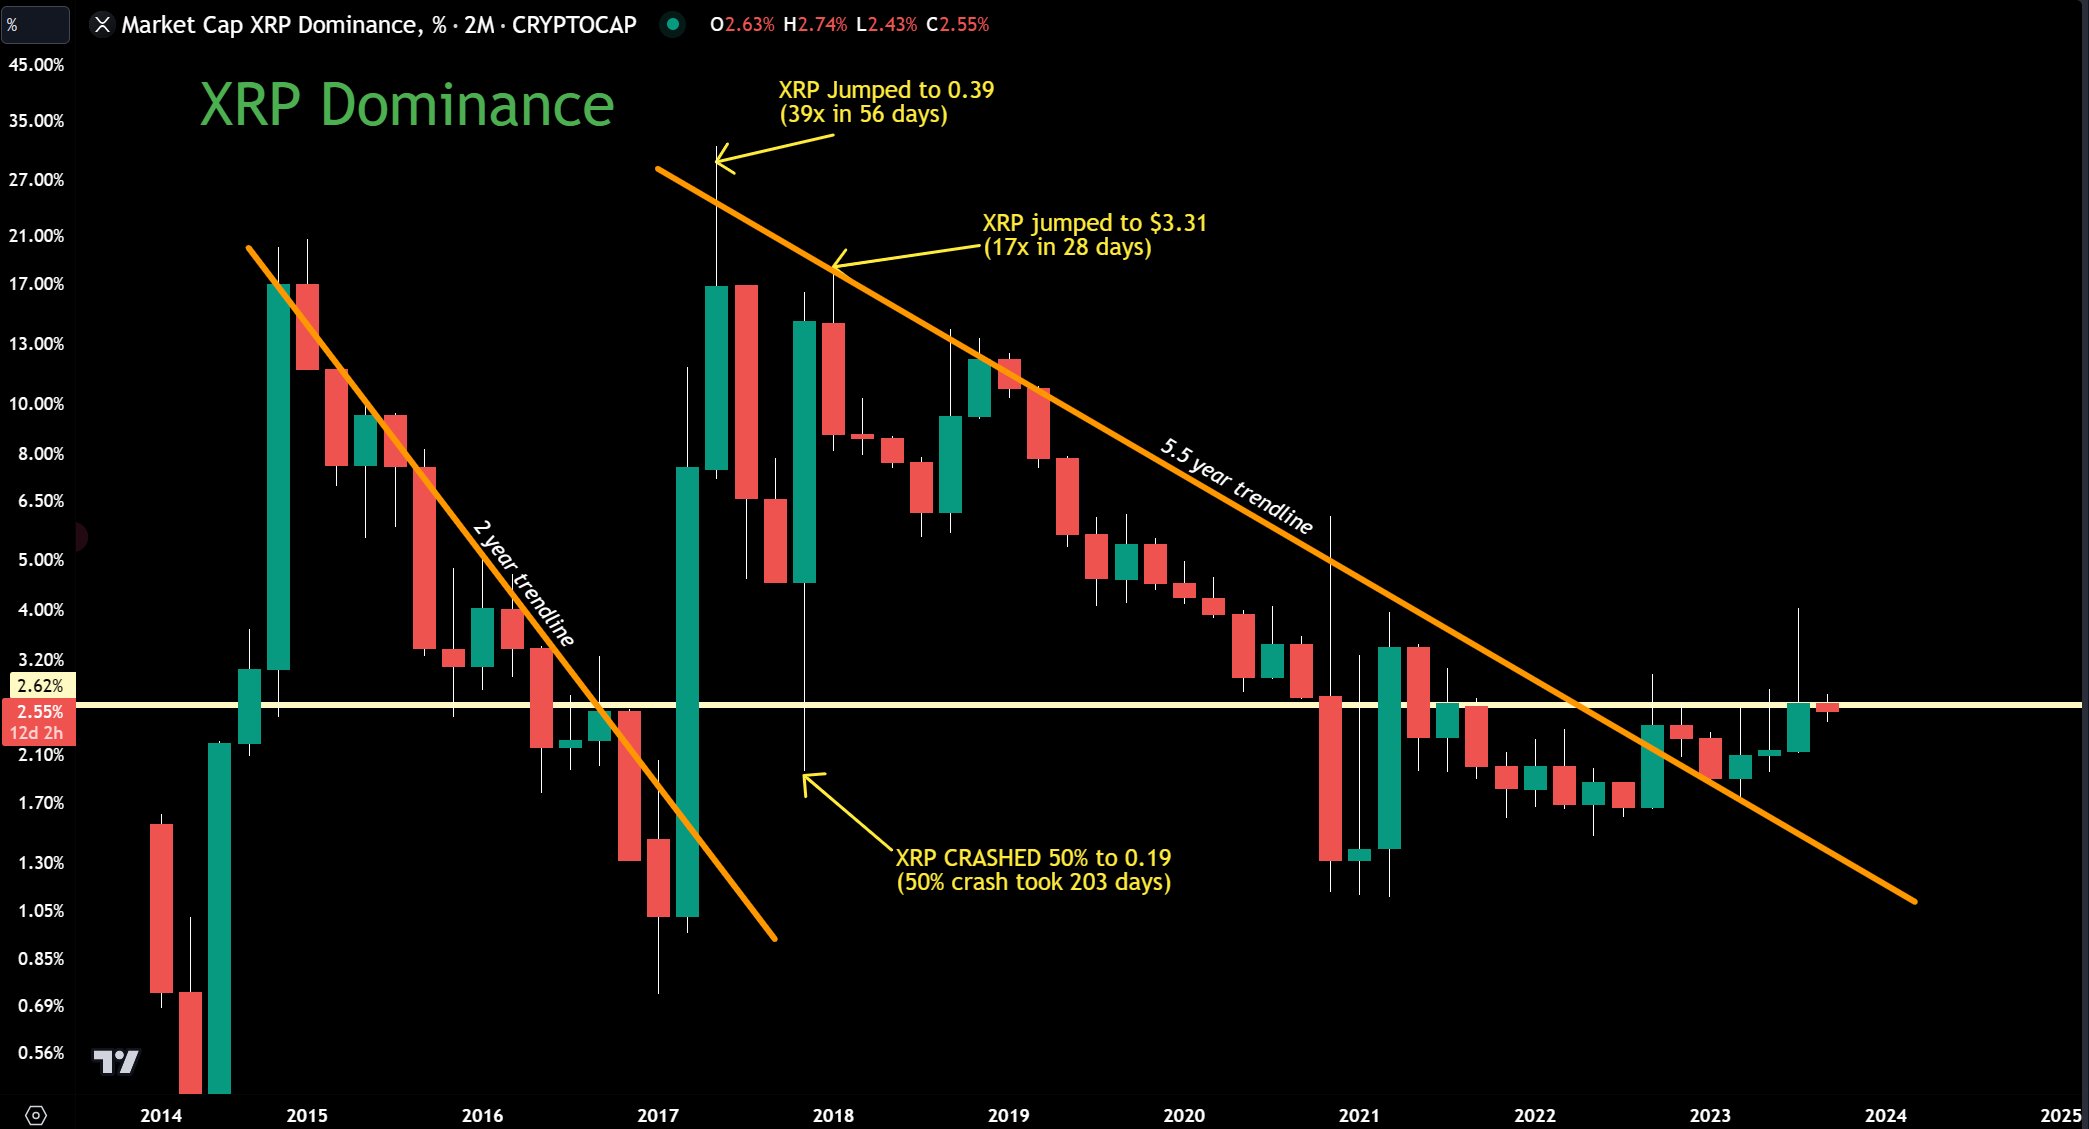
Crypto analyst Jaydee recently took to X (formerly Twitter), sharing another intriguing chart of XRP. The analyst presented the 2-month XRP dominance chart spanning from 2014 till today, shedding light on the cryptocurrency’s historical and potential future price actions. This examination brings to focus a falling trend line and a horizontal resistance line, which showcases a critical XRP dominance level at 2.62% that could be key for the price’s next parabolic move.

XRP Dominance Sits Just Below Key Level

Delving into the historical performance, the chart showcases moments when the token experienced rapid increases and furious drops in terms of crypto market dominance. There was a period where XRP underwent a staggering 39x price jump, reaching $0.39 in just 56 days in 2017. Shortly after, another surge saw the digital asset climb 17x within 28 days, marking its value at $3.31.
XRP Dominance, 2-month chart
XRP dominance, 2-month chart | Source: X @jaydee_757

Both times, the dominance was rejected at the yellow 5.5-year trend line. This resistance line has consistently acted as a major barrier to XRP’s dominance in the crypto market. Every approach or touch of this line led to significant price actions toward the downside.

Remarkably, the cryptocurrency’s price experienced a similar situation from 2015 to 2017 when the dominance was also held below a falling trend line for more than two years. However, the breakout of this trend signaled a massive price surge as XRP dominance rose from merely 1% to above 30% in just four months in 2017.

Fast-forward to today, the cryptocurrency could be in a similar situation as in 2017. It has breached the trend and is moving beyond the red trend line. However, instead of an instant surge as in 2017, XRP’s dominance now contends with the pivotal 2.62% mark.

See also  Analyzing Ethereum's recent price drop and $1B outflow

According to the analyst’s chart, it’s currently at 2.55%, narrowly missing the critical level. Notably, over the past 14 months, dominance hasn’t achieved a close above 2.62% on the bi-monthly chart. However, if it does surpass this threshold, it might signal the onset of the next parabolic ascent, as outlined by Jaydee.

Currently hitting the yellow resistance line. If we can have a full 2-month candle close above the yellow resistance line, expect the next parabolic move! Is 2024 the year?

Weekly Chart: When ‘Moon’?

Jaydee shared another chart on X (formerly Twitter) today, stating with regards to the weekly XRP/USD chart: “Still creating higher high (HH) in Price while lower low (LL) in RSI and SRSI on the WEEKLY, while bouncing off the 2-year trend line.” From this, he discerns three key takeaways before XRP can “moon.”

First, the cryptocurrency needs to gather momentum. He suggests that it needs to break past the $0.54 mark, at least on the daily chart. Second, the Stochastic RSI (SRSI) for the weekly timeframe should cross the 20-level, indicating potential for a bullish move. Lastly, the most important point in Jaydee’s analysis is the yellow 6-year trendline. For XRP to witness a parabolic move, breaking this trendline is imperative.
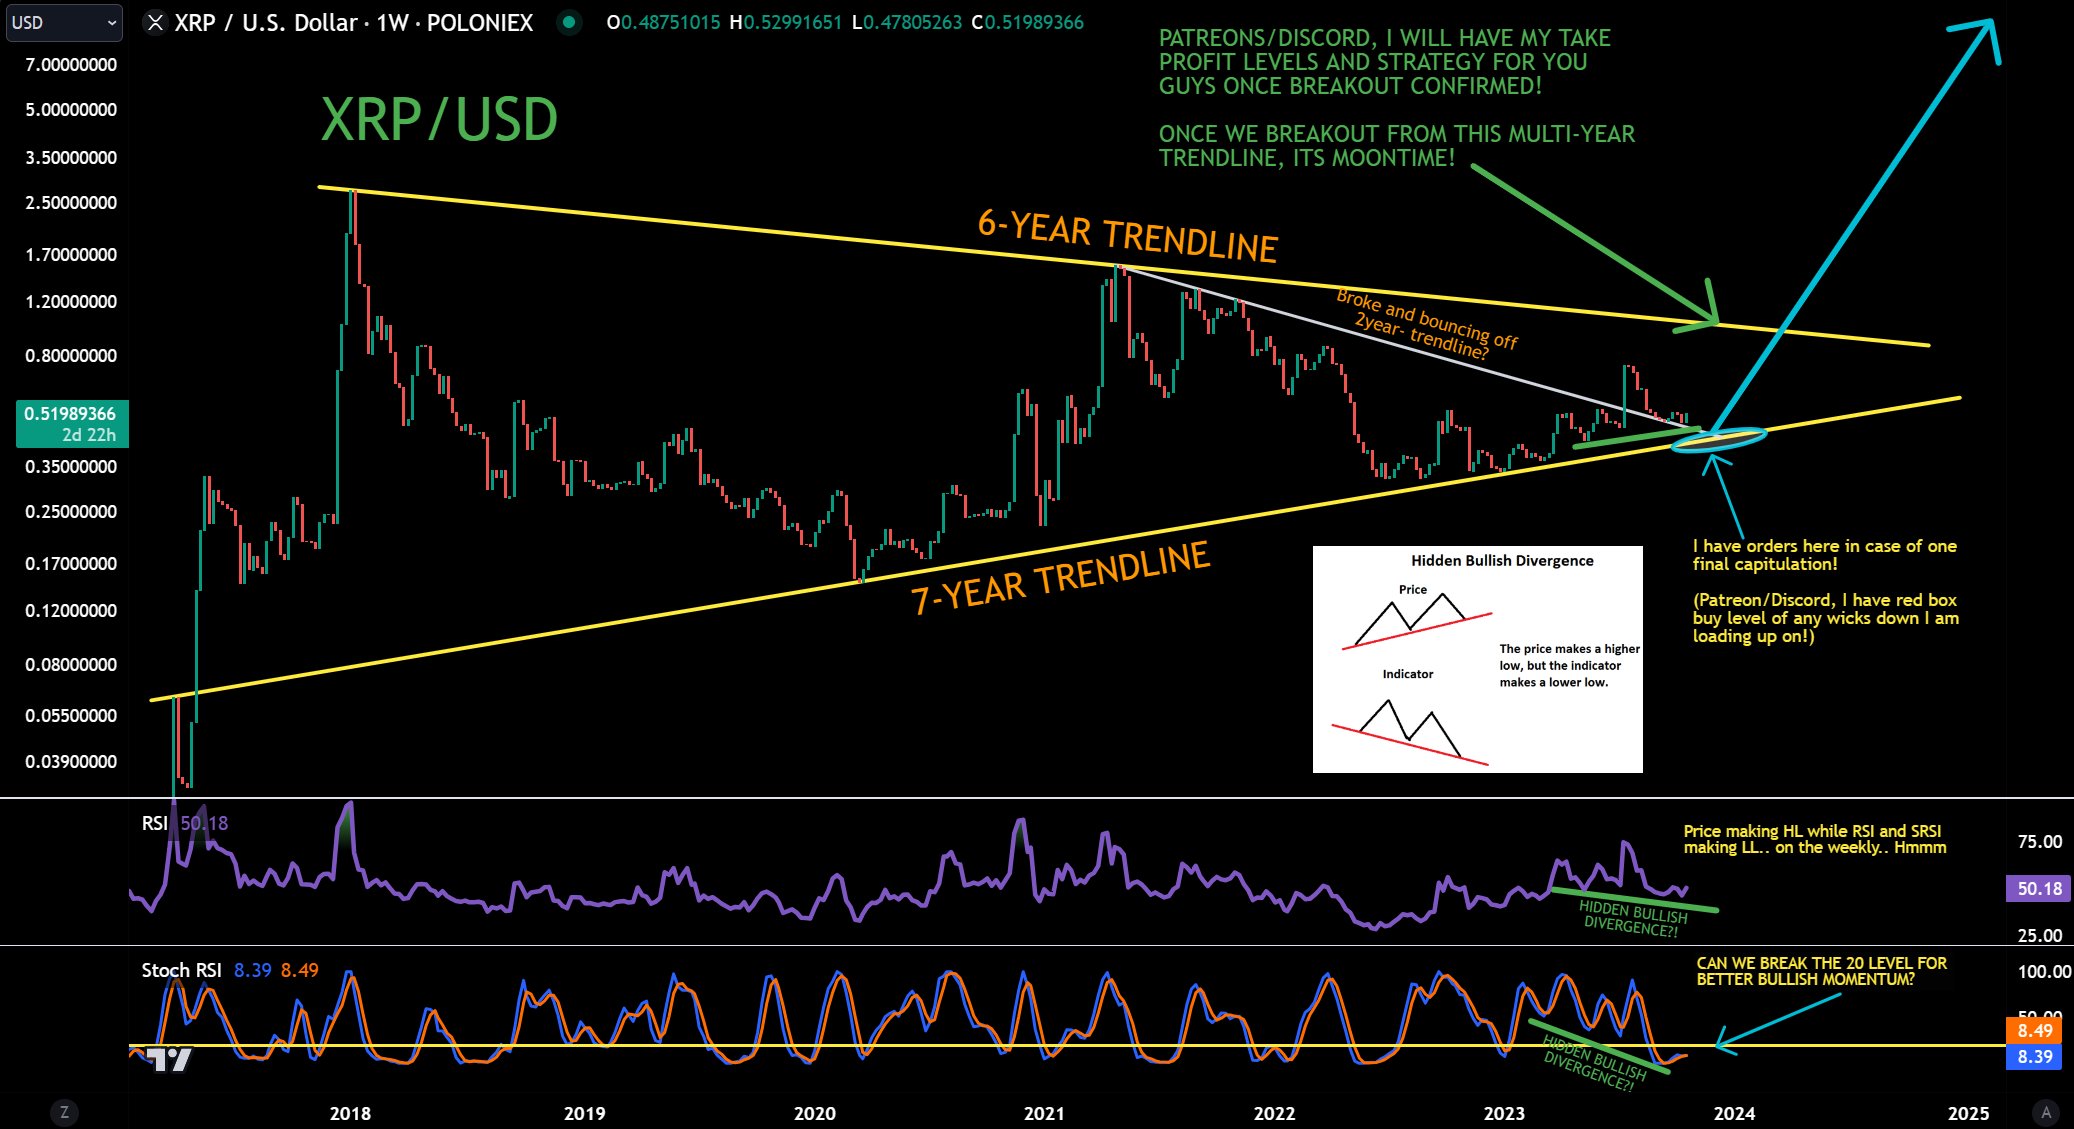
XRP USD chart
XRP/USD weekly chart | Source: X @jaydee_757

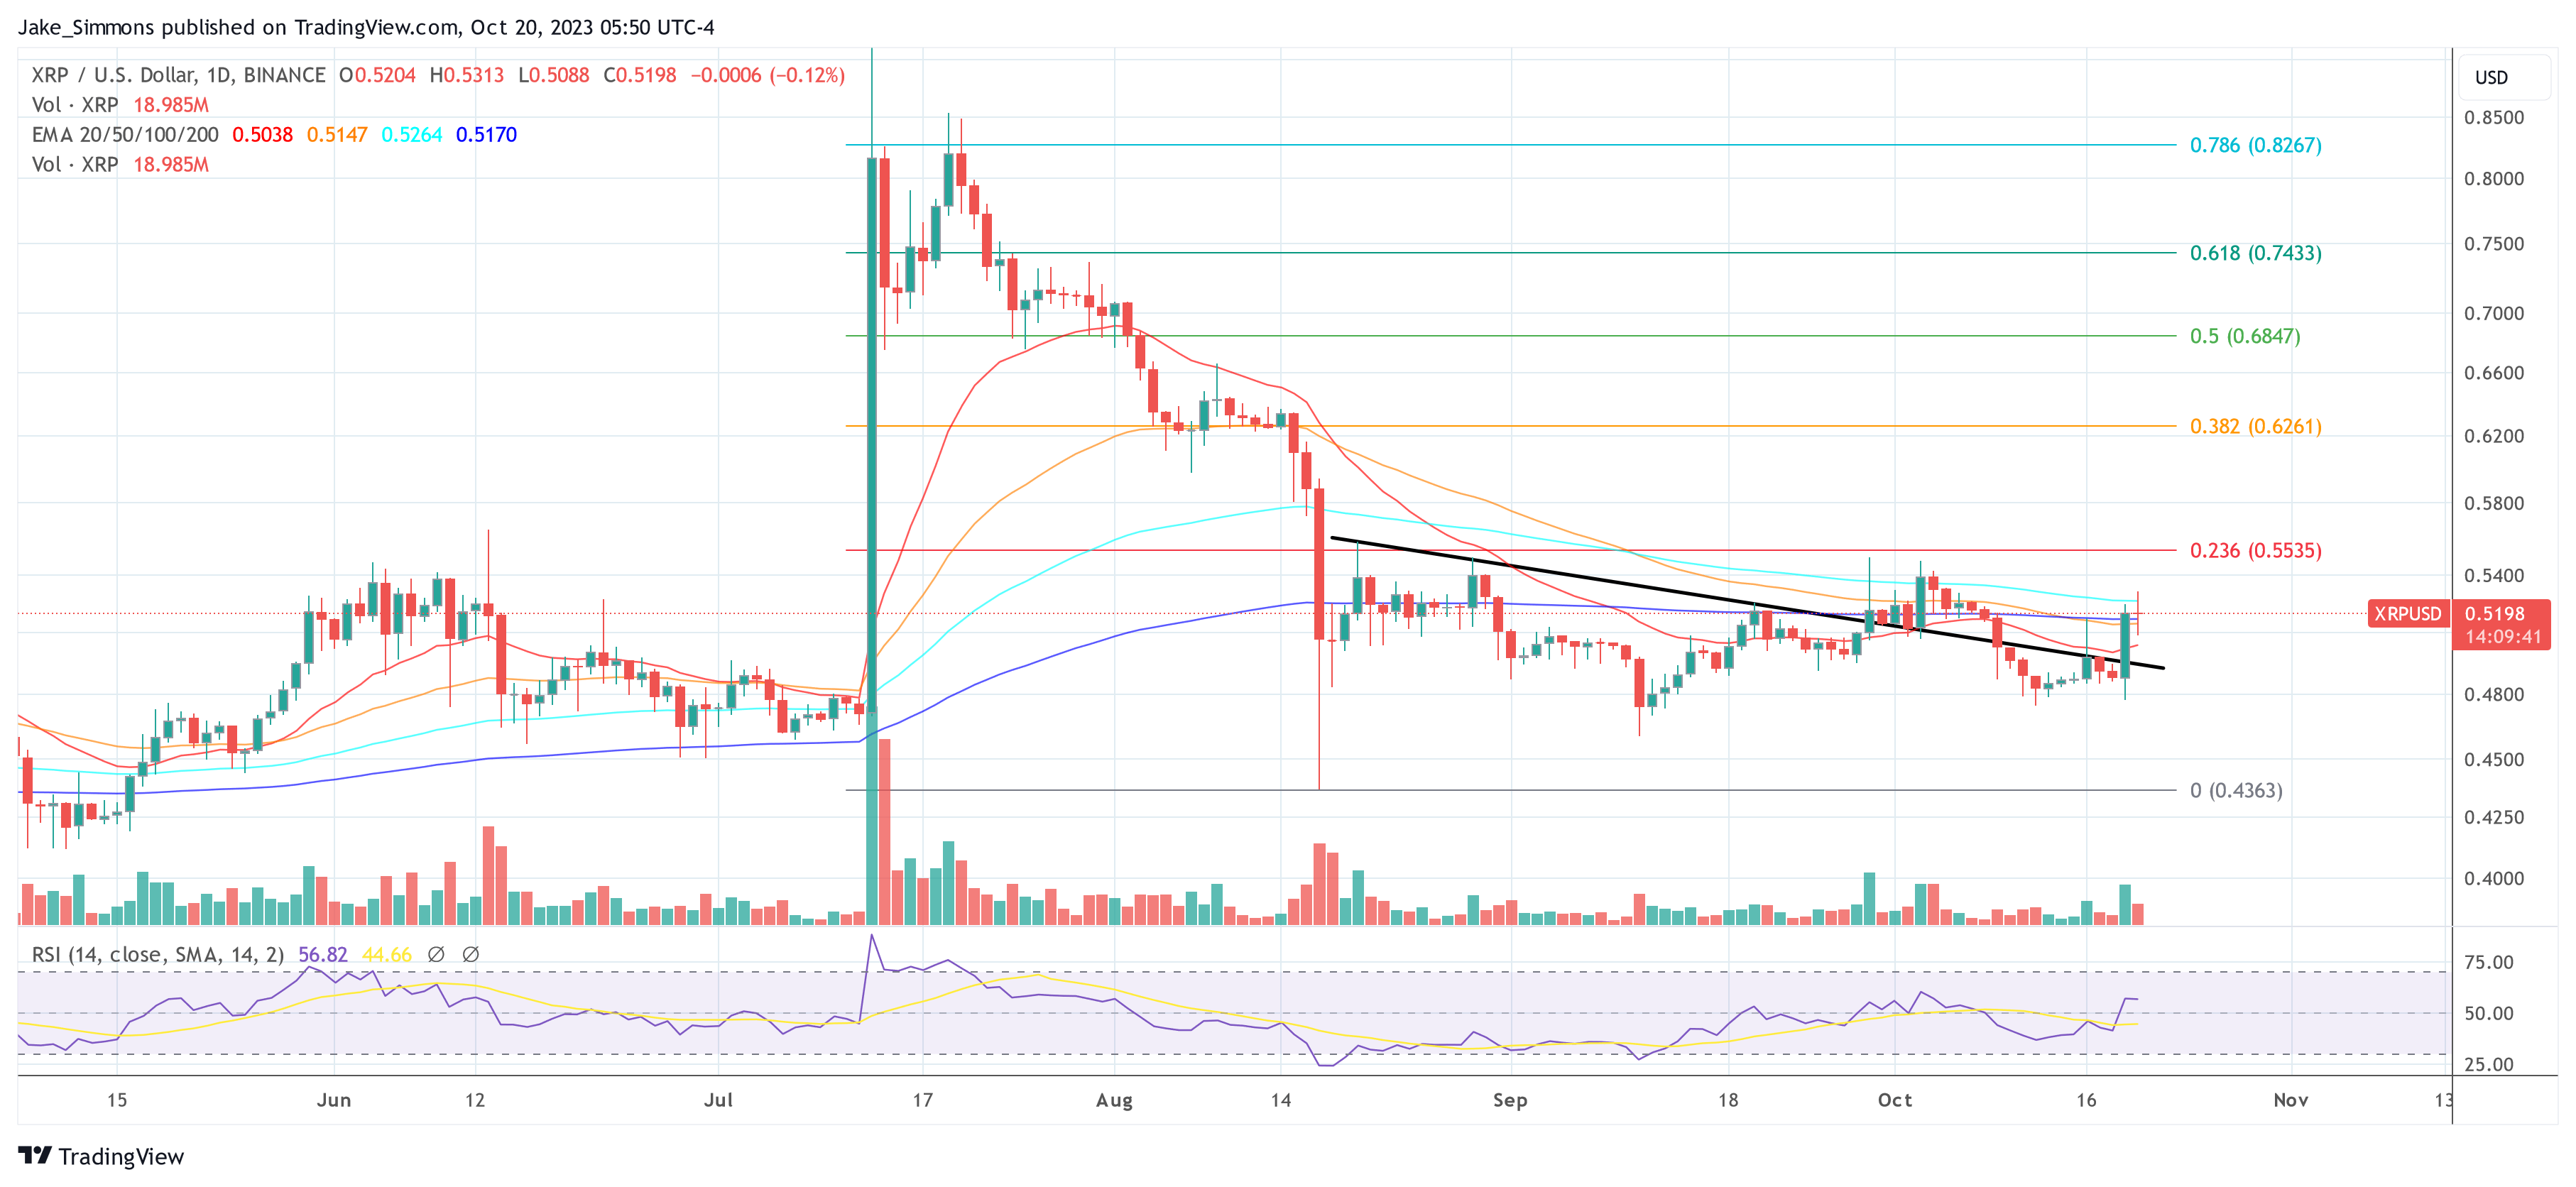
At press time, XRP traded at 0.5198.

XRP price
XRP rises above the 200D EMA, 1-day chart | Source: XRPUSD on TradingView.com

Featured image from iStock, chart from TradingView.com



Source link

Dominance move Parabolic Price reveals Start XRP
Share. Facebook Twitter Pinterest LinkedIn Tumblr Email

Related Posts

What Is Bitcoin Halving & How Does It Affect BTC Price?

September 1, 2026

What Is XRP? Ripple and XRP Ledger Explained

June 16, 2026

Parabolic SAR Crypto Guide: Signals, Settings, and Risks

May 13, 2026

Bitcoin Dominance Explained: Meaning, Formula, and BTC.D

May 1, 2026
Add A Comment

Leave A Reply Cancel Reply

Top Posts

Is Staking Crypto Safe? What You Should Know Before Staking

September 15, 2026

What Is the CLARITY Act and What Does It Mean for Crypto?

September 14, 2026

What Is Cross Margin in Crypto? How It Works, Risks, and Examples

September 14, 2026

Subscribe to Updates

Get the latest news and Update from VIP Crypto Signals about Crypto, Web3, Metaverse, NFT and more.

Our mission is to develop a community of people who try to make financially sound decisions. The website strives to educate individuals in making wise choices about Cryptocurrencies, NFT, Metaverse and more.

We're social. Connect with us:

Facebook Twitter Instagram Pinterest YouTube
Top Insights

Is Staking Crypto Safe? What You Should Know Before Staking

September 15, 2026

What Is the CLARITY Act and What Does It Mean for Crypto?

September 14, 2026

What Is Cross Margin in Crypto? How It Works, Risks, and Examples

September 14, 2026
Get Informed

Subscribe to Updates

Get the latest news and Update from VIP Crypto Signals about Crypto, Web3, Metaverse, NFT and more.

Facebook Twitter Instagram Pinterest
  • Contact
  • Disclosure
  • Privacy Policy
  • Terms & conditions
© 2026 Vip Crypto Signals - All rights reserved.

Type above and press Enter to search. Press Esc to cancel.

  • FibSwap DEXFibSwap DEX(FIBO)$0.0084659.90%
  • bitcoinBitcoin(BTC)$70,953.006.13%
  • ethereumEthereum(ETH)$3,664.5818.50%
  • tetherTether(USDT)$1.00-0.01%
  • binancecoinBNB(BNB)$627.698.99%
  • solanaSolana(SOL)$181.131.69%
  • staked-etherLido Staked Ether(STETH)$3,662.5418.48%
  • usd-coinUSDC(USDC)$1.00-0.02%
  • rippleXRP(XRP)$0.545.05%
  • dogecoinDogecoin(DOGE)$0.1634778.14%